


Industrial Renewal Research
PAS Report 104
Historic PAS Report Series
Welcome to the American Planning Association's historical archive of PAS Reports from the 1950s and 1960s, offering glimpses into planning issues of yesteryear.
Use the search above to find current APA content on planning topics and trends of today.

|
AMERICAN SOCIETY OF PLANNING OFFICIALS 1313 EAST 60TH STREET — CHICAGO 37 ILLINOIS |
|
| Information Report No. 104 | November 1957 |
Industrial Renewal Research
Download original report (pdf)
The importance of the right kinds of industry to the economic well-being of a city is no longer questioned by sensible men. Laws authorizing cities to issue revenue bonds for construction of industrial buildings, the adoption of zoning ordinances favorable to industry, and the competition of cities, states, and regions for new plants are prominent signs of the times.
In general, land offered to new industry is located on the outskirts of urban areas. It may even be prime land in a planned industrial district 100 acres or more in size. Most in-town industrial sites — which for many reasons are highly desirable — are already developed and few are available. At the same time, many manufacturing concerns want to move away from central industrial areas because, for one reason or another, their present facilities are no longer adequate.
The movement of industry from central to peripheral locations has been analyzed in several studies. One of the recent ones is that made by the Detroit City Plan Commission: Industrial Study: A Survey of Existing Conditions and Attitudes of Detroit's Industry (Master Plan Technical Report, Second Series, 1956, 186 pp., append.). In this survey it was found that 10.9 per cent of all manufacturing and 9.7 per cent of all nonmanufacturing industries had definite plans to move out of the city. Altogether these firms employ a total of 18,600 persons. In addition, 23.1 per cent of the manufacturing and 12.6 per cent of the nonmanufacturing industries in the city would prefer to be outside of Detroit. These firms employ an additional 58,370 employees.
Shortage of land for expansion and parking, obsolescence of buildings in terms of age and number of stories, and the inadequacy of thoroughfares for the movement of goods and workers were found to be the chief factors that conditioned the attitudes of industrial management toward present sites.
However, obsolescence is not an overnight process. Many factories that are not yet blighted nevertheless are beginning to show some of the signs of obsolescence. In Detroit and elsewhere, the factors that have caused a relatively small number of industrial buildings and sites to outlive their usefulness are continuing to work on a much larger number.
In this manner, older industrial sections present the same kind of a dilemma as blighted residential neighborhoods. So built up that they cannot be used for new plants, at the same time they are something less than desirable for the industries that are already there. Furthermore, the natural trend, if uninterrupted by purposive action, is progressively downwards as the built-in expandability of industries in peripheral areas increases their competitive advantage. The situation possesses few economic resources for self-renewal.
It is now becoming apparent that cities have more than a negligible interest in the modernization of central industrial areas. Deterioration of these areas, though less obvious than slum housing, is also an economic loss to the comnunity. In time, industrial slums and blighted areas may turn out to be just as costly as their residential counterparts because financial loss is measured not only in terms of tax revenue but also in jobs, profits, and, ultimately, purchases of goods and services.
Other factors also weigh heavily in the decision of plant management to move. Among them in Detroit, according to the attitude survey, were taxes (personal), labor problems, and a shift in market. Whether these causes would have been decisive if the physical condition of the plants had been reasonably satisfactory was not determined. What this report does show is that though the causes of industrial migration are numerous and complex, high on the list are problems of industrial environment, which, as the authors point out, "are amenable to physical planning solutions."
To what extent land shortages, obsolescent buildings, and inadequate thoroughfares can be remedied under existing programs remains to be seen. In some cases, land cleared of slum dwellings has been turned to industrial use. But since federal funds are available only where the area is predominantly residential either before or after redevelopment, this program cannot be relied on to solve a major part of the central industrial area problem. (For an excellent analysis of the federally aided redevelopment see Redevelopment for Industrial Use, by Robert B. Garrabrant, Technical Bulletin No. 25, Urban Land Institute, 1737 K Street N. W., Washington 6, D. C., 1955. 32 pp. $3).
Also, the vast amount of new freeway construction anticipated under the federal highway program can do a great deal to help the movement of trucks to and from congested industrial sectors. But on narrow, badly paved local streets, with too many intersections, freeways will have little effect.1
Whatever programs for industrial area conservation and renewal are developed, the facts about the nature and extent of industrial blight must be discovered before solutions can be proposed. To get the facts, the right kinds of questions must be asked. It is with the design and scope of special industrial renewal research techniques that this report is mainly concerned.
Quality of Industrial Plant
Just when people began to be concerned about the condition of centrally located plants is not certain. Probably their concern coincided with the discovery that an appreciable number of industries were moving out of the city to more favorable locations. Investigation into causes or migration revealed that structures and surroundings were out of date. The place of obsolescence in the picture of industrial migration was brought out in a study titled Manufactural Occupance in the West Central Area of Chicago, by Marcel J. De Meirleir (Research Paper No. 11, Department of Geography, University of Chicago, 1950. 251 pp.). Out of nine reasons why industries in that area wanted to leave their present sites, four sounded a refrain: lack of space for expansion; a better building is required; plant is located in a congested slum area; loading facilities are insufficient and there is no space to provide them.
After the identification of a condition, the next step is to analyze its elements. Here a parallel to the slum clearance program can be drawn: the evils of slum housing were recognized for decades before techniques were developed to deal with them. What the American Public Health Association's Committee on the Hygiene of Housing did was to produce tools that were capable of measuring fundamental deficiencies in quantitative terms.
Similarly, obsolescence as a cause of industrial migration has now been recognized as an undesirable state of affairs. The problem, then, is to develop an appraisal technique to see what kind of treatment is warranted, if any.
Within the past year, two planning commissions have tackled this problem and have published their findings. Both studies were influenced by APHA's Appraisal Method for Measuring the Quality of Housing. However, they differ in purpose, scope, and detail.
The St. Louis study, as the title implies is mainly experimental: Measuring Deterioration in Commercial and Industrial Areas — the Development of a Method (1957. 207 pp., illus.). It was conducted by the St. Louis City Plan Commission under a demonstration grant from the Urban Renewal Administration of the Housing and Home Finance Agency. (In accordance with the terms of the grant, copies of the study are available from the City Plan Commission, Civil Courts Building, St. Louis, or the Demonstration Program Branch, URA, HHFA, Washington 25, D. C.)
The Detroit study, on the other hand, is chiefly investigative: Industrial Renewal — A Comparative Study of the Tendency Toward Obsolescence and Deterioration in Major Industrial Areas in the City of Detroit. It was conducted by the Detroit City Plan Commission as a part of the Master Plan Technical Reports, Second Series. (The report mentioned above, Industrial Renewal, is No. 3 and Industrial Study, mentioned on page 3 is No. 4 in the series. They are the two concerned with industry and should be considered together.) Like the APHA housing appraisal method, each study attempts to determine environmental as well as structural deficiencies. Buildings, environment, and economic factors are all scored on a point system and rated. Ratings are combined to give a block rating, and in Detroit block ratings are combined to give an industrial area rating.
The main features of the two studies are outlined in the following pages. (Agency staffs considering similar investigations should examine the studies themselves for detailed information on appraisal techniques.) In making comparisons between them, it should be kept in mind that the St. Louis study deals with five small test areas located at different points within the city and investigates commercial as well as industrial properties; the Detroit study deals with virtually all of the industrial land within the city. The "industrial corridors" frequently referred to hereafter are concentrations of industry that extend along the Detroit rail network. Their boundaries are physical barriers (major thoroughfares, railroads, or rivers) as designated in the official land use plan. That study is directed to industrial uses only, although the incidence of dwellings in industrial areas was noted as a factor contributing to industrial blight.
| ST. LOUIS | DETROIT |
| Purpose of Study | |
| The project approved had as its goal the development, testing, and evaluation of a series of measurements designed to ascertain the relative obsolescence or deterioration of nonresidential structures and areas. (Editor's note: emphasis is on methodology.) |
1. To provide current information on the amount and degree of obsolescence and deterioration within the industrial corridors of the city. 2. To delimit the areas within the industrial corridors most in need of renewal. 3. To provide the background information necessary in arriving at solutions to the planning problems found within the corridors. 4. To complement the information presented in the current industrial land use survey. 5. To serve as a key resource in the redefining of the master plan industrial corridors which is to be undertaken in a future study. (Editor's note: emphasis is on findings.) |
| Basic questions | |
| to which answers are needed: 1. What are the causes of nonresidential blight? Or, are the causes and evidences of nonresidential decay so interwoven as to defy separation? 2. Once identified, can such factors be objectively measured and do they apply uniformly to all structures or areas? 3. On what unit basis are these elements to be considered? 4. Can enterprises be deemed "blighted" if they continue to be profitable? 5. What is the stake of the municipality in the rating of nonresidential areas? |
to be answered by the study: 1. What are the factors that indicate industrial obsolescence and deterioration? 2. How is industrial obsolescence and deterioration to be measured? 3. Will data such as that found in the Sanborn atlas, assessor's rolls, building department records, and field observations provide sufficient information? 4. After the information is assembled and processed can it be rated with consistent weights to produce an objective answer to the presence and degree of industrial obsolescence and deterioration? |
When the subject of investigation is complex — as an industrial area certainly is — deciding on the kinds and amount of information to be gathered is probably the most critical step in the whole process. On the one hand, it is essential to the success of the study that questions be asked that will give the information needed. On the other hand, the material must be manageable because the amount of information to be collected will determine the time and money spent in making field surveys and in compiling and analyzing data.
Research objectives and uses to which collected data will be put should be carefully thought out in advance. Before the form and contents of the data schedule are finally settled on, each item should be evaluated to see if it is actually necessary. Both the St. Louis and the Detroit research groups found that making pilot studies to test forms and procedures resulted in substantial modifications and improvements.
At a stage in each study, deficiency factors along the following general lines were considered:
Physical condition and description of structure
Use of building
Type of construction
Number of stories
Year built
Physical condition of structure
Nonconformity of building to building, health, fire, and other codes
Environmental factors
Site area
Adequacy of:public services
streets
parking — on- and off-street docking facilities
truck facilities
harbor facilitiesNuisance elements originating in or outside area
Suitability of topography to type of land use
Overcrowding of buildings on land
Mixture of inharmonious land uses
Building used in violation of zoning or master plan
Poor housekeeping — accumulation of rubbish
Nonconformity of buildings in area to health, building, fire, and other codes
High crime or delinquency rate in area
Lack of adequate living facilities for employees within convenient traveling distance
Lack of recreation space and facilities for workers on off-time
Relations with people in neighborhood not good
Economic factors
Is building vacant?
Is building used for other than what was originally intended?
Did building decline more in property value than average building of its type?
Is there a high incidence of tax delinquency in area?
Absence of new construction in area if land is available
Building obsolete — not adaptable to modern operations
Poorly located in relation to customers and supply
Lack of modernization and improvement
Assessed land values in excess of the valuation on improvements
High rate of occupancy turnover
Surely these questions all seem relevant to the problem of measuring industrial obsolescence and blight. The practical problem, however, is how either to reduce or to amplify this list of items in order to attain research objectives within the time and money limits of the budget. Since the purpose of the St. Louis study was to develop a methodology and the purpose of the Detroit study was to make findings for land use planning, different paths were followed.
In the course of the St. Louis study, approximately 130 main questions were asked about conditions of structure and environment. A schedule resembling the APHA dwelling unit schedules was completed for each building in the five study areas. One sheet of this schedule is reproduced as Figure 1 to show form and detail. Most of the required data were secured by field survey. Inspection was made on foot, and members of the inspection teams entered buildings to complete items on the schedule.
Figure 1. Page from Structure Schedule, Non-residential Research Survey, St. Louis

In the Detroit Industrial Renewal study, however, the number of factors to be checked were reduced to ten2 and were considered indicators of a tendency toward obsolescence and deterioration:
Physical condition, height, and vacancies of major industrial structures.
- Walls broken, cracked, out of plumb.
- Foundation rotting, broken, cracked.
- Chimney, stairs, other building appendages, rotting, broken, parts missing.
- Buildings of wood frame construction.
- Vacant structures.
- Major buildings more than one story in height [with some exception].
Environment
- Conflicting land uses.
- Overcrowding of land.
- Poor streets, inadequate parking and off-street loading.
- Nuisance elements.
Blocks rather than individual structures were rated. Specifically, a block was scored on the basis of the degree to which a percentage of buildings within it contained these elements. All data were secured in the field. Rating was done entirely from a moving automobile.
| ST. LOUIS | DETROIT | |||||||||||||||||||||||||||
| Scoring | ||||||||||||||||||||||||||||
| (Editor's note: The summaries that follow are necessarily brief and greatly oversimplified. Their purpose is merely to indicate methods of scoring structures and environment. The St. Louis column particularly fails to reflect the detail of inquiry pursued in the actual survey. "Total quality" or "total rating" maps are shown in Figure 2.) | ||||||||||||||||||||||||||||
| On a penalty system with highest scores denoting poorest conditions. Items were rated under the headings: Building Features Building Appurtenances Building Condition Building Occupancy Site Features Environmental Features Individual structures and sites were scored.
Median block scores were prepared and charted for each heading and for "total quality." |
Three grades, with highest grade denoting poorest conditions. Structural and environmental factors were scored separately for each block. For structure; a 3-point numerical system was devised to rate the structure on the basis of physical condition, vacancies, and height of buildings. Blocks were rated on the percentage of buildings in the block that contained the factors selected. For environment, the three symbols X, /, and blank, were chosen to indicate the degree to which factors selected were found in the block. Structural and environmental factors were combined to give a total block rating. From the block ratings, total corridor ratings were computed. The nine possible combinations resulting were placed in four classes which represent tendency toward obsolescence and deterioration:
Class (4) — Clearance and redevelopment Class (3) — Combination of redevelopment and conservation Classes (2) and (1) — Conservation |
|||||||||||||||||||||||||||
| Findings and Conclusions | ||||||||||||||||||||||||||||
| Items selected for appraisal and penalties used in scoring are re-examined and evaluated. Each item was considered for retention, discard, or modification in future schedules. Also, an attempt was made to determine the break point, in penalty points, at which a "basic deficiency" could be identified. The approach reveals the typical or general quality of each block and the particular quality of each structure. From the heading scores (building features, appurtenances, etc.) remedial treatment by way of added parking or loading facilities can be ascertained; high environmental scores show generally lack of adequate municipal maintenance of streets and sidewalks; high condition scores indicate blocks in which deterioration has reached a point as to virtually preclude rehabilitation. |
Program to renew and rebuild city's industrial areas must approach problem in two ways: 1. Remove housing and other nonindustrial land uses to provide needed space for plant expansion. (Housing recommended for clearance in master plan studies would provide 1,750 acres of land in corridors.) 2. Along with clearance of nonindustrial uses must go a program to remove the many badly blighted and obsolete industrial structures in the corridors. In addition to providing more land, this action would also allow redesigning the street system within the corridors. See also recommended action, on previous page. Plans and procedures to renew and redevelop the industrial corridors will be in a subsequent report. |
|||||||||||||||||||||||||||
Figure 2. Total Quality Charts

Industrial Density
Just as overcrowding of land and dwellings is a measure of residential blight, so can percentage of land covered by buildings and number of manufacturing employees per acre3 be considered measures of industrial blight. However, the basis for industrial measures is not equally unequivocal. Minimum housing standards are related to health and safety and pertain regardless of type of dwelling. To the extent that a dwelling falls short it is considered blighted.
However, no uniform criteria of overcrowding can be applied to industrial buildings. What would be overcrowded for one manufacturing process is not for another. To choose an extreme example we have only to think of the New York garment industry, a high-density operation that is located mainly in loft buildings. Chiefly reflecting it are the figures for number of acres per 1,000 employees, which in Manhattan is only 1.50 acres, (or 667 employees an acre). In contrast, acres per 1,000 employees is 8.39 in Brooklyn, and 91.54 in the borough of Richmond (Plan for Rezoning the City of New York, Harrison Ballard & Allen, 123 East 77th Street, New York 21, 1950).
Therefore, to get even a rough idea of the extent of overcrowding in central industrial areas, plants in the study area must be compared — not with average density figures — but with the density (land coverage and number of employees to an acre) of a typical modern plant that employs the same processes and produces the same kind of goods.
One difficulty is that sufficient criteria are not available at the present time. By far the best source of information on density characteristics of modern plant types in the United States is Dorothy A. Muncy's study of 220 factory sites and facilities built with federal funds during World War II, which, as the author points out, "had all the best space features of modern plant design," and "were designed for modern production methods and tools." Titled Space for Industry — An Analysis of Site and Location Requirements, it covers such points as land area, floor space, major shift employment, structural density, and parking and loading (Urban Land Institute Technical Bulletin No. 23, Urban Land Institute, Washington, D. C., 1954, $5).
An advantageous feature of Mrs. Muncy's report is that each type of plant is identified by name and code number, to the fourth digit, as defined by the Standard Industrial Classification Manual.4 For example:
| MAJOR GROUP | 37 | TRANSPORTATION EQUIPMENT |
| Group No. | 372 | Aircraft and Parts |
| Industry No. | 3729 | Landing Gear |
The use of this breakdown means that an accurate description of the density characteristics of, for instance, a modern aircraft landing gear plant is available. The following examples, taken from two tables in Space for Industry, illustrate possible variations among plants within a group (three-digit designation). Notice that all are in the 372 series and that two have the same industry number.
| Industry No. | Acres | Employees/Acre | |
| 3722 | Radiator tubing | 5–9 | 50–74 |
| 3729 | Hydraulic units | 10–14 | 15–24 |
| 3722 | Super-chargers | 25–49 | 25–49 |
| 3721 | Aircraft assembly (no airport) | 100–249 | 15–24 |
These examples demonstrate that the use of a group average (on the basis of site area or ratio of employees per acre, in this instance) as a test of the adequacy of a particular factory would be misleading and of little value. And averages of these characteristics of major groups would be of even less value for that purpose.
Lacking precise standards, how is the investigator of urban industrial blight to measure degree of plant deterioration?
One way is to summarize the density characteristics of the industrial plants in a study area. These characteristics can then be compared with the general characteristics of modern plants.
In the group of industries studied by Mrs. Muncy they were found to be, in summary:
Land area — More than seven out of ten have less than 100 acres. (However, only one out of four had less than ten acres.)
Total floor space — More than 60 per cent have between 100,000 and 1,000,000 square feet.
Employment on major shift — More than six out of every ten plants have less than 1,000 employees on the major shift.
Structural density — Almost eight out of ten plants have less than 35 per cent of sites covered by structures.
Employment Density — Six out of ten have less than 25 major shift employees per acre of site.
Parking ratios — 85 per cent have at least one parking space for every 3.4 employees on the combined major and second shifts (Equivalent to one space for every two workers on major shift.)
Off-street loading facilities — Only two of the 220 plants lack off-street loading facilities, and most have separate incoming and outgoing shipping areas.
Rail facilities — 86.9 per cent have rail service on site.5
Before moving on to surveys in which density factors were taken as indicators of industrial area decline, we should note that they were not included in the St. Louis industrial and commercial areas demonstration survey described in the first part. Land coverage, floor area ratio, and employee density were all rejected, mainly because the chief components that make up these measures were covered under other items:
Given the space required for adequate parking and loading, for which penalties were levied under building requirements, and the set back and height restrictions as imposed by the zoning ordinance and building code, which were also noted previously, remaining considerations appear to relate only to aesthetic values of open area, planting strips, etc., or to traffic generating qualities of the greater densities. For the former no rational means of establishing penalties seemed possible. As to traffic generation two methods were attempted, but neither proved acceptable.
The first method related to employee densities within the several structures in any block. For purely industrial areas a standard might have been justified but in commercial areas employee figures do not represent the traffic generating capacity for such districts. In a complementary study an effort was made to relate the number of trucks known to move to and from a block in a day to either the net or to gross block area. The fallacy in this approach was brought out because of such uses as dairies, bottling works, bakeries, breweries, etc., where vehicles are concentrated at morning and evening hours and may create considerable congestion despite an apparently generous amount of land area per vehicle. For these reasons no penalties were levied on coverage or density bases. Additional study might reveal a technique which would prove acceptable, however.
How industrial density analyses have been isolated and employed in several studies of industrial area adequacy will be described in the next two sections.
Employee Density6
Though possibly not the first survey to use manufacturing employee density as a measure of industrial area congestion, the Cincinnati Metropolitan Master Plan Study, Industrial Areas, (City Planning Commission; 1946. 75 pp., illus.) was one of the earliest. For the purposes of that report, 18 industrial areas were defined "on the basis of present concentrations of industry, without reference either to municipal corporation lines, or to official industrial districts where such districts have been created by zoning." The value of this measure is described in the following paragraphs, taken from the Cincinnati report.
The best common denominator, for comprehending the broad characteristics of the industrial land use pattern from one area to another is the average number of employees per acre, as given in Table 3.7 As will be seen from this table, density of manufacturing employment per acre has wide variation in the Cincinnati Area. At one extreme is the crowded Downtown Area, with an average density of 506 persons per acre in the loft building sections and 168 persons per acre in the remaining sections; at the other extremes are the . . . areas, with the very low density of 3.5 to 10.1 persons per acre.
Broadly speaking, Table 3 is an indicator of those industrial areas which are congested and those which are not. There is an almost perfect inverse correlation between number of employees per acre and distance from the center of the city. Furthermore, if an average of 40 or more employees per acre is taken to be a rough measure of congestion, it would appear that half a dozen areas are now congested.
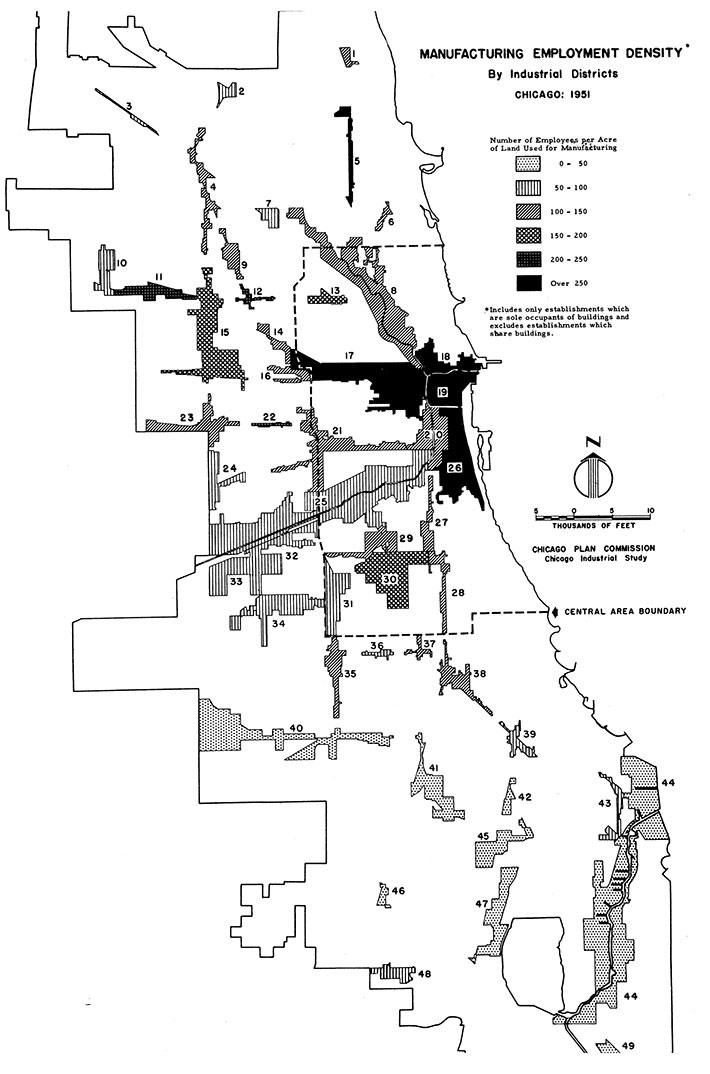
The Cincinnati industrial areas survey was made mainly to determine future land requirements in a comprehensive land use plan of the metropolitan area. A later one —Chicago Industrial Study (Survey Report, Chicago Plan Commission, 1952, 58 pp., illus.) — also was intended to be used in the formulation of an industrial land use plan.8 However, it also formed the basis of a policy statement adopted by the plan commission, which recognizes the need for an improvement program. It reads in part:
The number of Chicago industries occupying obsolete buildings makes relocation and the replacement of such structures a continuous process. This is an important factor in assessing the future industrial land needs of a city where more than one-fourth of the industrial buildings are over 40 years old.
Like other industrial land studies, the Chicago report covered many facets of the problem. Concerning the measure of employee density as an indicator, the report said:
The number of workers per acre of land used for manufacturing (employment density) is a useful index of the concentration or intensity of land use. This ratio is based on the total land area of the site, including such facilities as loading areas, and is a more satisfactory measure than either the total floor area or the ground floor area of the building. Although there are some prominent exceptions, a very high employment density is frequently indicative either of congested land use practices dictated by high land costs or of operations in obsolete plants without sufficient space for efficient layouts or future expansion. The high employment densities . . . in some districts of the Central Area are indicative neither of uniformly intensive land use throughout the district nor of efficient land utilization. Many manufacturing operations in the Central Area are crowded into multistory buildings which are surrounded by partially empty buildings or small plots of vacant land.
It was found that in Chicago at that time the average was "100 employees per acre of land occupied by manufacturing establishments which are the sole occupants of their building." This figure was approximately twice the average employment density of 40 industrial plants that had recently been built in the city. The density range is shown in Figure 3, reproduced from the Chicago report. "Core" industries had densities in excess of 250 employees an acre.
Figure 3
In the Detroit Industrial Study (described previously) the number of workers per acre on the highest shift was also used as "an indicator of land crowding." For the purposes of evaluating industrial corridors and the city as a whole, data were broken down by corridor and by major industry group. Forty workers an acre again appears to be the threshold of land crowding. On a corridor-wide basis (all corridors in city), seven out of ten firms indicated that their plants exceeded this mark. How each corridor was rated is shown in the table following (which appeared in the Detroit study):
| Ratio of Plants Employing 40 or More Workers Per Acre on Highest Shift | |
| Corridor | Ratio* |
| 1 | 7 |
| 2 | 6 |
| 3 | 1 |
| 4 | 7 |
| 5 | 2 |
| 6 | 7 |
| 7 | 9 |
| 8 | 8 |
| 9 | 9 |
| 10 | 8 |
| 11 | 6 |
| 12 | 7 |
| 13 | 7 |
| 14 | 10 |
| 15 | 9 |
| 16 | 8 |
| 17 | 10 |
| 18 | 7 |
| 19 | 6 |
| 20 | 1 |
| 21 | 7 |
| 22 | 7 |
| 23 | 8 |
| 24 | 6 |
| 25 | 6 |
| 26 | 6 |
| 27 | 6 |
| Corridor-wide | 7 |
*The number of plants out of ten employing 40 or more workers per acre.
The median for the city of Detroit (which included plants located outside and inside the corridors) was 69.3 workers an acre. This figure was compared with modern plant practices as described in Mrs. Muncy's study (namely, that six out of ten plants have fewer than 25 major shift employees per acre). It was found that almost three-quarters of all plant managers replying to a questionnaire had an employee density ratio of 40 or more workers an acre.
The major industry group breakdown followed the classification of the Standard Industrial Classification Manual. A few examples are selected from one of the tables for purposes of illustrating findings. Although a slight tendency for densities to cluster may be detected, on the whole the ratios of employees per acre run the gamut. Headings and arrangement are modified slightly; numbers in column headings are the major group numbers of the S.I.C. Manual.
| Employees per acre* | 32 Stone, clay, & glass products |
33 Primary metal industries |
35 Machinery (except electrical) |
36 Elec. mach., equip., & supplies |
| Under 10 | 1 | 1 | 5 | - |
| 10 – 20 | 6 | 6 | 6 | - |
| 20 – 30 | 2 | 9 | 20 | - |
| 30 – 40 | 4 | 7 | 20 | 2 |
| 40 – 60 | 5 | 12 | 46 | 2 |
| 60 – 80 | 1 | 9 | 46 | 2 |
| 80 – 100 | 3 | 7 | 28 | - |
| 100 – 130 | 2 | 1 | 32 | 4 |
| 130 – 160 | - | 3 | 20 | 2 |
| 160 – 200 | 1 | 1 | 9 | 1 |
| 200 and over | 1 | 2 | 25 | 4 |
| Cannot be calculated | 8 | 11 | 85 | 8 |
| Total | 34 | 69 | 342 | 25 |
| Number Reporting | 26 | 58 | 257 | 17 |
*Major shift
Land coverage
Percentage of land covered by buildings is also a good indicator of intensity of manufacturing land use — or, since quality is being measured, of land crowding. High employee density tends to be associated with a high percentage of land covered. In Detroit, for instance, a correlation of .88 was found.
However, land coverage is an even more direct measure of total quality of the physical plant. Whereas employee density is partly a reflection of manufacturing processes, land coverage is a factor that indicates adequacy (or inadequacy) of the parcel related to its building. It is an independent measure of physical condition. High coverage in an old industrial area almost certainly shows that most sites lack off-street loading and parking areas and that room for expansion is virtually nil. Amenities found in modern plants, such as yards and landscaping, are all but nonexistent.
In Detroit, a city-wide median of 58.8 per cent land coverage was found, which contrasted unfavorably with the 35 per cent coverage predominating in modern plants. Also, 65 per cent of the plants in Detroit cover more than half of the sites on which they are located. Both the Detroit and the Chicago studies pointed out that the newer the building the lower the land coverage. However, in Detroit, land coverage began to rise again in the period from 1951 to 1954, indicating, it was suggested, that a shortage of big enough sites forced manufacturers to build on smaller parcels in order to stay within the city limits.
Future Trends
It would probably be unwise to be entirely satisfied with the general characteristics of industrial plants as they developed during the war or even as they exist now. It may be, of course, that the plant type developed in the late 'forties will not change much for some time to come. On the other hand, if industrial operations are undergoing modification in a way that widens the difference between new and old, then the rate of central area industrial decline can be expected to accelerate, rather than diminish.
If we cannot predict the factory of the future, can we identify some of the developments in technology that are influencing its size and shape? That certain general factors "may be expected to exert their influence for a long time to came in most industries" was pointed out in Industrial Land Use for Philadelphia (Comprehensive Plan Report No. 1, Philadelphia City Planning Commission, 1950, 49 pp., illus.). Other developments influencing plant size were brought out in an unpublished bulletin, "Land Planning for Industry," prepared by the Denver planning office in 1953. These factors are grouped according to positive and negative influences.
TOWARD A RELATIVE INCREASE IN AREA
Philadelphia report
1. As a result of increasing mechanization of industrial processes, of increase in motive power per worker and of increase in training and skill of the workers, the number and size of machines supervised by one worker will increase. Consequently, floor area required per worker will increase.
2. Increased use of heavy and bulky machinery and of conveyor methods require floor area of high load-bearing capacity and with a minimum interruption by columns; these can be supplied much more economically in one-story than in multistory buildings. The desire for ample and equal daylight can also only be satisfied in one-story structures. Therefore, one-story structures will be the predominant type and, consequently, ground area of factory structure required per unit of floor area will increase.3. With rising living standards, requirements for parking areas, landscaping, and facilities for health, welfare, and recreation of workers on the factory grounds will increase. Consequently, ground area of plant required per ground area of factory structure will increase.
The cumulative effect of the increase in these three ratios will require large tracts which generally can be found only in undeveloped outlying areas. This location will, in turn:
4. Increase the requirements for parking of workers' cars, and
5. Lead to a more liberal use of space and to the acquisition of land reserves because of the low land costs in such outlying areas.
Denver report
1. Advent of trucking with requirements for extensive loading aprons and parking space for both trucks and employees.
2. Increasing ownership and use of automobiles by employees, requiring extensive off-street parking space on the plant site.
3. Increasing taste for attractive architecture and landscaping.
4. Management foresight in allowing extra land for future plant expansion.
TOWARD A RELATIVE DECREASE IN AREA:
Philadelphia report
1. Better plant layout results in more rational use of available ground and floor area.
2. Better scheduling of purchases and sales results in decreased requirements for storage of inventories.
3. Better economic planning may lead to better utilization of existing plant and a reduction of excess capacity.
Denver report
1. Improved technology, permitting greater concentration of process.
2. Tendency away from storage in plant.
3. Relative increase in land cost in maturing industrial areas, particularly those close to center of city.
4. Relative increase in cost of new plant construction, resulting in effort to concentrate higher volume of usage in original plant.
Another factor of more recent origin, which will occur to many readers, is the automation movement. Though in some respects a facet of increasing mechanization of production, it is essentially something new and different. The definition of automation given by the Subcommittee on Economic Stabilization to the Joint Committee on the Economic Report, Congress of the United States (1955) is:
. . . the essential element in modern automation appears to be the introduction of self-regulating devices into the industrial sequence through the feedback principle whereby electronic sensing devices automatically pass information back to earlier parts of the processing machine, correcting for tool wear or other items calling for control.
Certain manufacturing processes lend themselves to automation, especially those that process materials that are mainly fluid. The petroleum and chemical industries are leading examples of continuous process industries. Others, like the electronics industry, virtually exist on large-scale use of automatic and semi-automatic equipment. A producer of discrete units that is being rapidly automated is the machine tool industry. According to the Department of Commerce, increase in value added by manufacture9 between 1947 and 1954 was 130 per cent. How automation affects these and other industries is the substance of the hearings before the Subcommittee on Economic Stabilization, a 644-pagepublication titled Automation and Technological Change (Superintendent of Documents, U. S. Government Printing Office, Washington 25, D. C., 1955, $2).
A second recent development that bears watching as an influence on plant site size is the federal and state highway construction program. If high land costs, caused by competition for space, are part of the reasons for land coverage, then relatively low land costs might be expected to have the opposite effect. That is, the availability of large tracts of cheap farm land may augment the tendency already noted to use space more liberally.
Summary and Conclusions
Because of APHA's pioneer appraisal method for measuring the quality of housing, we have the basis of a technique that can be adapted to nonresidential uses. The obsolescence of industrial uses in particular is worthy of attention because of large investments in buildings and equipment. The up-to-dateness of a plant is affected to the extent that technological changes affect manufacturing method, mode of transporting goods, and travel habits of employees.
As residential areas become blighted because they no longer function properly as places to live, so industrial areas become blighted when they no longer function properly as places to produce goods.
The criteria of residential area obsolescence are based on the health, welfare, and safety of people. The criteria of industrial area obsolescence, on the other hand, are based on the economic health and welfare of industry.
To draw still another analogy: industrial slums, like residential slums, have structural and environmental features that can be measured. However, obsolescence is a matter of degree, and hence the appropriate corrective treatment varies. The urban renewal concepts of conservation, rehabilitation, and clearance and rebuilding may be considered for industrial areas as well.
Several questions emerge from a study of industrial obsolescence. One of the important ones is whether central areas, without the help of municipal programs, can hope to compete with outlying areas. A corollary is whether public action that creates outlying low-density industrial zones on a large scale, that encourages planned industrial districts, and that opens up land through construction of limited-access highways is hastening the decline of central industrial areas — whatever merit is to be found in these actions for other reasons.
There is also the interesting question of how far cities should go in acquiring land for industrial expansion and parking lots. And finally, there is the question of what kinds of remedial action can be taken to stop industrial area deterioration and to renew it through redevelopment, rehabilitation, and conservation.
Programs to upgrade central industrial areas have been suggested in planning commission studies of industrial land use and obsolescence, though probably only a beginning has been made. Some of these, and others suggested by the nature of the problem, are:
1. Improvement of techniques of measuring industrial obsolescence — structural dilapidation and environmental factors that contribute to the inadequacy of a plant for manufacturing purposes.
2. Collection of standard and up-to-date statistical data on modern plant characteristics of the sort outlined in the National Industrial Zoning Committee's report, Characteristics of Modern Industrial Plants and Their Relationship to Industrial Zoning (1952), and the previously mentioned Urban Land Institute's report, Space for Industry, by Mrs. Muncy. Possibly consideration should be given to the collection by the quinquennial census of manufacturers of industrial density data for establishments built since the last census.
3. Utilization, where feasible, of the slum clearance program to make large parcels of land available for industry. Resale price of land acquired by an authority having eminent domain powers is usually competitive. The total cost per square foot of acquiring land in Chicago's West Central Industrial District project, located one mile from the Loop, was $4.20. This price included site improvements, tenant relocation, administrative costs, and legal fees, as well as cost of land purchase. (The price actually paid to former owners, either through negotiation or condemnation, averaged $3.23 a square foot.) Acreage sold by the Land Clearance Commission to industrial developers averaged $2.68 a square foot. This figure is comparable to the square-foot price of small vacant parcels scattered throughout the Chicago central area.
4. Formation of industrial development corporations for the purpose of acquiring sites and financing construction of buildings in central areas. (For information on the extent of community financing of factory buildings see various issues of the Area Development Bulletin, published by the Office of Area Development, U. S. Department of Commerce and available from the Superintendent of Documents, U. S. Government Printing Office, Washington 25, D. C. for 50 cents a year.)
5. Collection of information on the kinds of small industries that do not require large buildings and plant sites. In the Detroit industrial study, for instance, it was found that 61 per cent of industries that moved into or within central industrial corridors employed fewer than 50 workers. The chief reason for moving industries was need for more space, which indicates that the buildings vacated by some concerns because they are too small may be large enough for others.
The Chicago industrial study also commented on "the important role of the Central Area, with its supply of industrial floor space, in serving as an incubator for smaller industries which may later move to other parts of Chicago and the Metropolitan Area."
These observations suggest that structures in good physical condition but inadequate in size and interior arrangement for one tenant, may be highly desirable for another, if sufficient parking and loading space can also be supplied.
6. Clearance of housing and other nonindustrial uses, of badly blighted and obsolete industrial structures, redesign of local streets, and provision of off-street parking and loading space would be big steps toward the making of an industrial environment more suitable for modern plants —both large and small.
7. Investigation of ways, other than redevelopment, to alleviate the shortage of parking space for employees of plants located in downtown industrial areas. The Milwaukee city parking commission, for instance, is considering a preferential curb parking system. Under this system, some of the streets near factories, now posted with two-hour meter restrictions, would be open to unlimited parking. An essential part of the proposal is the construction of city-owned parking lots with a charge of only 25 cents a day to employees.
Endnotes
1 The other side of the federal highway coin is the impetus this program will give to peripheral industrial development. See PLANNING ADVISORY SERVICE Information Report No. 71, The Urbanizing Influence of the Expressway and the Need for Planning and Zoning, February 1955. Also, "Influence of the New Highway Program on Industrial Location," by Dorothy A. Muncy, Industrial Development, June 1957. It is too early to tell whether new metropolitan freeways will bring a gain or a loss to declining industrial areas in the central city.
2 However, the Detroit Industrial Study secured individual plant data on many other items by means of a questionnaire. See for example, the next section, headed "Industrial Density."
3 The number of manufacturing employees an acre is sometimes used as a base for forecasting future industrial land requirements in a metropolitan area. See Urban Land Use Planning, by F. Stuart Chapin, Jr., Chapter 12, "Space Requirements" (Harper & Brothers, New York, 1957. 397 pp., il1us. $8.). Also a recent planning agency report, How Much Industrial Zoning for Metropolitan Indianapolis? (Metropolitan Planning Department of Marion County, City Hall, Indianapolis 4, 18 pp.)
4 The SIC Manual was prepared by the Bureau of the Budget to aid in securing uniformity and comparability of statistical data. A new edition is now available from the Superintendent of Documents, U. S. Government Printing Office, Washington 25, D. C., for $2.50. Though this new edition combines previous manuals, the industrial classification reflects recent technological and organizational changes in American industry.
5 Editor's note: rail service was a virtual necessity for factories built during World War II. In the present period, many plants will settle for a good location with respect to trucking routes, if product and market permit.
6 This term as used here refers only to manufacturing employees. The number of office workers at a particular plant would affect the need for off-street parking at that plant but not the characteristic ratio of manufacturing workers per acre.
7 A table headed "Number of acres of land in industrial use, number of occupied sites, estimated normal number of employees, and number of employees per acre, by industrial acres."
8 Material collected in this survey was used in the rezoning project, which culminated in the adoption of a new comprehensive zoning ordinance by the city council in 1957.
9 "Value added by manufacture" represents the value of manufactured products shipped by the plants of an industry, less their cost of materials, supplies, fuel, energy, etc. It is the best value measure available for comparing the relative economic importance of manufacturing industries.
Copyright, American Society of Planning Officials, 1957.