


Population Forecasting
PAS Report 17
Historic PAS Report Series
Welcome to the American Planning Association's historical archive of PAS Reports from the 1950s and 1960s, offering glimpses into planning issues of yesteryear.
Use the search above to find current APA content on planning topics and trends of today.

|
AMERICAN SOCIETY OF PLANNING OFFICIALS 1313 EAST 60TH STREET — CHICAGO 37 ILLINOIS |
|
| Information Report No. 17 | August 1950 |
Population Forecasting
Download original report (pdf)
THE NEED FOR FORECASTING POPULATION
In the solution of any planning problem, the planner either makes an explicit forecast, or makes some implicit assumption about the population for which he is planning. "Population" includes much more than mere numbers of people. The planner must know what kind of people live in his planning area, what types of lives they lead, and would like to lead, how long they will live, and how long they will reside in the particular area; and who will replace them when they move out or die; how many children they will have (and would like to have under different conditions), whether these children will live in the area, and many other factors.
Many communities have installed facilities which have become useless because predicated on faulty estimates of future population, or they have failed to install facilities where justified by future population. A common example of such errors is the newly constructed school in an area where the population is aging rather than being replaced by young, child-bearing families. Sewer systems have been expensively developed only to be later replaced because the population soon was double or triple what was anticipated for the area. Narrow streets have been later widened at great expense. On the other hand, land often has been overly zoned for commercial purposes in the expectation of a vast increase in population which did not materialize. Or land was zoned for potential capacities in some cities of whole state or even the entire population of the country. Prematurely subdivided land is plaguing many of our communities today.
BACKGROUND
Demography, the study of population, tries to find the answers to the questions of what types and numbers of persons can be expected to reside in an area at a future date. Population analysts have found that changes in population, the aspect most important to the planner, are related to other social and economic changes. The rate of industrialization and its effects on population growth is perhaps the most important relationship.
In Western civilization, increased knowledge and application of science and technology has over the last 150 years sharply decreased the death rate. During this period, the birth rate has also been lowered, mainly through the practice of birth control. Since the birth rate decreased more slowly than the death rate, a large increase in population took place in the Western world in the 19th and 20th centuries. In the most industrialized countries the death rate today has almost reached the present biological minimum, but since birth rates also continue to fall, population increase is being slowed. Northwestern, southern and central Europe, North America, Australia and New Zealand are among these countries which are identified as having a population of incipient decline.
In those countries which are undergoing the process of industrialization, the application of modern hygiene methods such as more widespread use of medical facilities and D. D. T., have decreased the death rate. The lowering of the death rate precedes the lowering of the birth rate, and consequently these countries are now undergoing or have undergone a very large population increase. These countries are said to be in the stage of transitional growth, and countries such as the Soviet Union, Japan and some Latin American countries are in the midst of this stage of population change while Turkey, Palestine and parts of North Africa seem to be entering it.
There are also a number of countries which are not yet industrialized to any great extent, such as China, India, Egypt, the Near East, and most of South and Central America, which have at present both a high birth rate and a high death rate, which prevents any large population increase. These countries are characterized as being of high growth potential since rapid growth may be expected as soon as technological developments make possible a decline in mortality.1
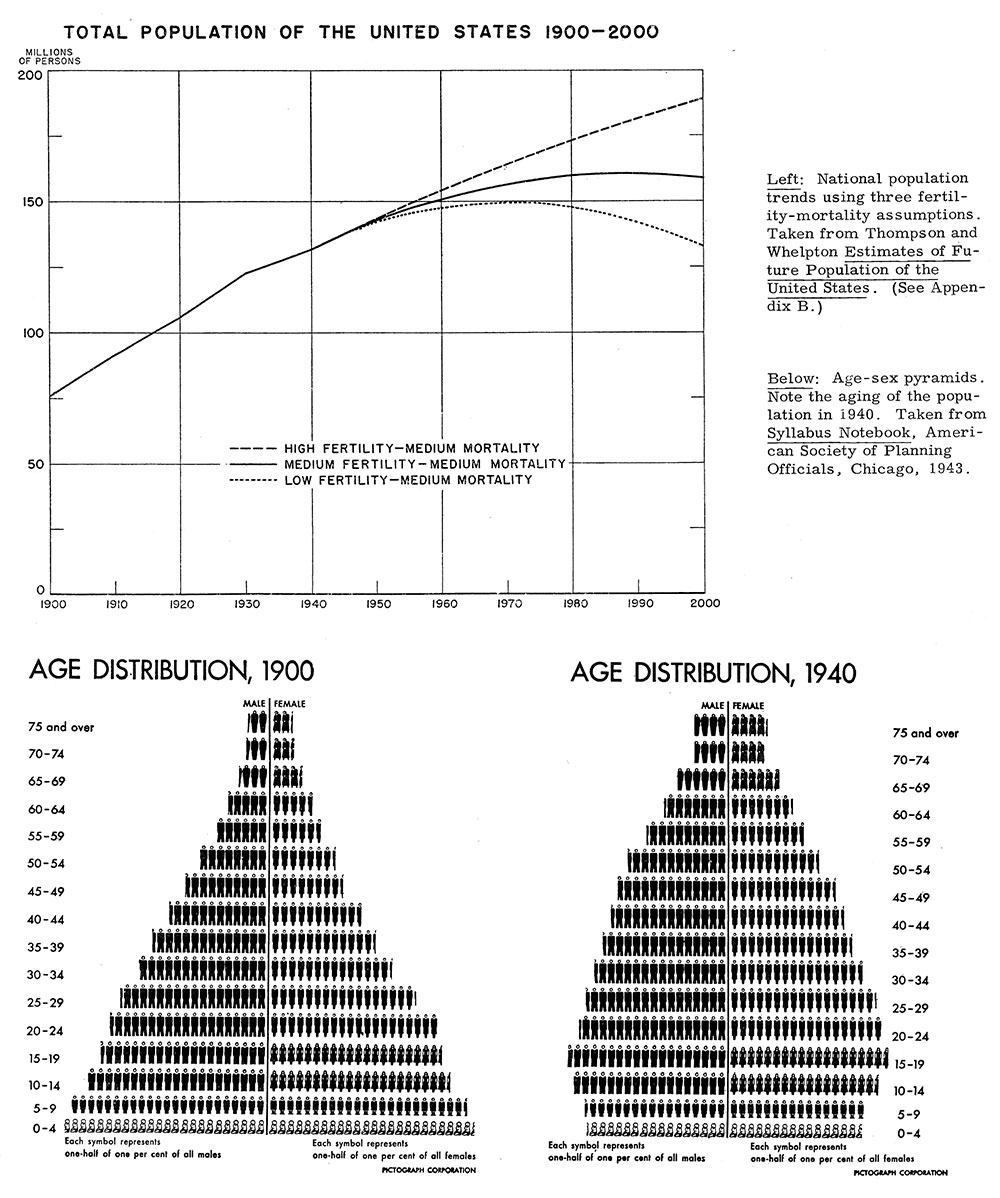
Generalizations about the United States, with its present low birth and low death rate, have been made which forecast an increasing population of older persons in the population, an increasing number of future births from the low-income groups and from particular ethnic, social and religious groups, and from rural populations. The United States has been identified as a country of incipient population decline since it is felt that with an increase in families of small size (with few or no children) the population will not reproduce itself. The age-sex pyramid, which charts the number of people by age groupings and sex is a useful tool for describing population characteristics, and, when used comparatively, for showing population change. (See Appendix A for examples of age-sex pyramids.)
Although the United States as a whole is classified as one of incipient decline, there are sections of the country (such as rural areas and neighborhoods of foreign-born in urban areas) where the birth rate is still quite high, and sanitation facilities, diet, etc., are deficient enough to keep the death rate above the national average. Infancy death rates are high, and the life expectancy (the average number of years a person may expect to live) may be five, ten or more years below the national figure.
The planner must be cognizant of the historical trend discussed briefly above. He must also be aware of the many different socio-economic groups present locally and in the nation. These groups have differing population reproduction and death rates, and also have with differing population "habits" — different attitudes about getting married, when to get married, when to have children, how to space them, and how many to have.2 They have differing ideas (and also pressures upon them) about moving, both within and between communities.
There are a number of over-all generalizations which show differences in population habits. It is known for instance that the size of family generally varies inversely with income and education, that low income groups have more children than high income groups, that farm families are larger than city ones, and that most families of foreign birth (perhaps not so much because they are foreign, as because they often have low incomes) have more children than native born people. In general, Catholic families in the United States have tended to have more children than those of most Protestant denominations. Although these generalizations have been valid, it does not mean that they will always apply. It is being noticed today, for instance, that some persons in professional occupations (who have been among those with the least children) now seem to be favoring larger families; the same is true of some high-income groups. The trend of urban migration out to the suburbs and dormitory towns seems also to encourage larger families in these "fringe" areas.
MAJOR DIFFICULTIES IN FORECASTING
Anticipating the numbers and characteristics of future population is very difficult. Since the planner is unable to fully foresee and therefore to predict future world social and economic conditions, he can only project what he thinks will happen to present trends in the future. He must make assumptions about the future, assumptions which may be outmoded or invalidated in a rapidly changing industrial society.
For the practising planner today there is another obstacle. The population analyst has generally been concerned with forecasting the future populations of whole countries, and diverse national trends tend to cancel out each other in the largeness of the figures. However, projection of population in small areas, such as county or city is a more difficult task, because an error in projection may not be balanced by another unforeseen event or influential factor, and because an error in projection may result in a variation important when compared to the small local total (although not important when compared to a national total). In addition, in- and out-migration for the local area must be projected; this is no easy task. This is especially true for populations of large cities where the major element of population change has been migration. This is also especially true of certain sections of the country — some West Coast communities have doubled or trebled their populations in less than a decade.
In spite of all the obstacles, none of which can be under-estimated, and all of which seem to announce the foolhardiness of any attempt, population projections must be made expertly enough so that the planner can perform his function planning for the future population of his area.
Projection: Mathematical Forecasting
There are two major groups of projection methods which may be labelled mathematical and analytic. The mathematical methods, used in the early attempts to project population, involve the charting of past and present population data, the determination of "trends" and the projection of these present population trends into the future. There are two types of mathematical projection: arithmetic and geometric.
ARITHMETIC PROJECTION
Arithmetic projection assumes the continuation of the amount of population change observed in what is defined as the base period, the period from which the projection is started, through successive equal intervals of time. Arithmetic projection, since it has been employed during periods of population increase, has generally been used to show population growth in fixed amounts. For example, it may be found that City X3 increased by 20,000 people every 10 years since 1910 (when its population was 100,000). Using the arithmetic method of population projection, 1910–1940 might be assumed as a base period. Thus 20,000 people would be added for every future decade. The population of City X would be expected to be 220,000 in the year 1970. This method has not been used often in planning reports, perhaps because it has been found in the past to under-estimate population growth.
GEOMETRIC PROJECTION
The geometric projection method has been much more popular. It looks at population changes in terms of percentage changes rather than numerical changes. For a simple comparative example, in City X the 1940 population (160,000) is 60 percent greater than that in 1910. Thus, by a simple trend projection, it would be expected to be 60 percent greater in 1970 than it was in 1940, or 256,000. Most geometric projections are, however, plotted over decade intervals where trends are derived from analysis of the changes between decades. In the above example, there was an increase of 20 percent in 1920 as compared to 1910, an increase of 16.667 percent in 1930 as compared to 1920, an increase of 14.286 percent in 1940 as compared to 1930. In this case, the computer would foresee an increase in population at a uniformly declining rate — first 1/5th of present population, then 1/6th, then 1/7th, 1/8th, 1/9th, etc.
Thus the base period for analyzing trends is as important as the method of projecting future populations, whether viewed in arithmetic or proportional terms.
One method which has been used to determine the rate of geometric population growth may be described as the "let's see how other cities (who were our size once) grew, and average out and project their experiences for our city" method. Another approach is to examine projections for future population of the country, or the state, which have been prepared by another agency (or to directly forecast population for these larger areas) and to assign a parallel proportionate population for the smaller area. For example, the present population of a state might be six million, and the city's population might be one half million, or one-twelfth of the state's total population. A forecast might have been made indicating the state's future population would be eight million. This method would assume the city's share would be one-twelfth or roughly 667,000 persons.
A major criticism of the method of deriving local figures from projected figures for larger areas is that the assumed relationship between a particular city and other cities, the nation or the state may exist, but may also vanish overnight, since no attempt has been made to discover the reasons for the relationship.4 Also, a main objection to projection of population at a fixed rate (whether numerically or proportionally) is the fact that an increase in population may affect the future rate of growth of population (a factor overlooked by using rigid increments).
DISADVANTAGES OF MATHEMATICAL PROJECTION METHODS
Usually, comparison of actual population with that estimated via geometric projection reveals that the estimate was much too large. A study of Oakland and Berkeley, California, done in 1915, made two predictions for San Francisco's population in 1940. One prophesized a population of 909,000 and the other 1,290,000. San Francisco's actual population in 1940 was 635,000. Two estimates made in 1931 for Cedar Rapids, Iowa for 1940 ranged between 74,000–80,000 while the actual population in 1940 was only 62,000. A 1920 Decatur, Illinois, study expected 85,000 by 1940 and 150,000 people by 1956, but in 1940 the city had only 59,000. On the other hand, the 1930 Master Plan for Rockland County and Ramapo, New York, had over-estimated 1940 population by only 5 percent, and a 1924 Memphis, Tennessee, study which assumed a 25 percent increase per decade, estimated its 1940 population at 255,000, while its population had actually climbed to 293,000 that year. In general, however, over-estimates are more frequent. If only some of these almost fantastic local population forecasts made in the past were added together, the result might have anticipated a population for the United States of close to a billion.
A major defect of the geometric method (that of assuming a constant proportional change) was supposedly eliminated by the logistic S shaped curve developed by Raymond Pearl. This geometric projection assumes that the percentage of growth will increase for a while, then decrease and finally in the dim future stabilize itself. A city, by analyzing its growth pattern, would simply have to find its present location on the S curve (whether increasing or decreasing) and then follow the type of trend Pearl and his associates worked out for New York City.
Predictions for two cities which used this method in 1924 and 1925 compare with actuality thus:
| 1940 ESTIMATE | 1940 ACTUAL | |
|---|---|---|
| Lexington, Kentucky (1924) | 60,000 | 49,000 |
| Kenosha, Wisconsin (1925) | 90,000 | 49,000 |
The advantage in using mathematical methods is that they are easy to compute, and that they sometimes have "worked." The methods are easy because the technique is (1) to assume a population increase without asking why this increase should take place, and (2) to assume that population trend lines will be static although the society changes in various ways. The fact that these methods have sometimes been successful when used for very short periods of projection is perhaps due to the fact that this country has enjoyed a fairly stable rate of population increase. It is generally felt today that this period is coming to an end, and mathematical methods are no longer acceptable. Perhaps the best uses to which the mathematical methods may be put are as checks on analytical methods.
Projection: Analytic Methods
The second group of projection methods has been labelled "analytic," because emphasis is placed on why population numbers and characteristics change. This method involves discovery of the factors that influence present and past population increase and decrease. On the basis of assumptions concerning the future of these factors, and of other factors that are just emerging in the community, projections of fertility, mortality and migration trends are made. The main concern, therefore, is on analysis of the factors that influence population changes rather than on determination and projection of trends.
ANALYTIC PROJECTION OF NATIONAL POPULATION
The analytical approach is generally associated with the work of P. K. Whelpton and Warren S. Thompson who used it in their estimates of future populations for the United States for the U. S. Bureau of the Census.5 After analyzing what were then present population trends, they discussed the various factors that might change or stabilize these trends in mortality, fertility, and migration. From this analysis they concluded that no single estimate could be made for the year of projection (2000); they therefore made three separate assumptions for a high, medium and low fertility and mortality rate and added migration assumptions to these. A population figure for the year 2000 was computed. They then carefully plotted (interpolated) a population curve from the year 1950 to the year 2000, being careful to adjust the slope of the curve (or rate of change) to empirical data based on their knowledge of trends. (See Appendix A for illustration.)
INTRODUCTION TO ANALYTIC PROJECTION PROCEDURE
That, briefly, is the analytic method for forecasting national populations. It is our purpose in the rest of the report, to discuss how this method can be adapted for the needs of the planner concerned with smaller local areas. (This method has already been used in some cases. See the Bibliography in Appendix B.)
The procedure used for the analytical method, as mentioned briefly above, is threefold: (1) to study present population trends, — the rate of decrease or increase of numbers of persons; the age and sex composition of the population; the fertility, mortality and migration patterns etc.; (2) to study the factors that have produced these trends, whether or not they will continue in the future, and the other factors that may appear; and (3) to make a series of assumptions about future factors and future trends. The emphasis of the procedure is on the assumptions made, and on the factors which make these assumptions reasonable. The essence of the method is to constantly ask questions: Why do we have so many old people in our city? Will they remain? And how will that affect the future population? Or, why has the ratio of urban and rural population in our county resembled the national figure for the last fifty years? And why should we assume it will stay that way? Or why should we assume that our city will grow the way City X did when it had the same number of persons we now have?
Once the questions are answered, (if they can be) it is less difficult to make assumptions about the future population trends. If the questions cannot be answered, the assumptions must still be made, and the planner must try to explicitly state what assumptions he is making so that in the future he can discard or revise those which no longer seem applicable. The assumptions that he makes may or may not be realized, depending on the competence of his analysis, and more important, on future events which may upset the stability of trends that must be assumed if a projection is to be made. Therefore, a number of separate assumptions must be made, and from these a number of projections should be evolved. Some of the studies cited below have used as many as nine to twelve different projections, each based on different assumptions. The entire process of making assumptions and projections must be presented in flexible form so that the planner can switch from one projection to another if events upset what he had considered his most reasonable set of assumptions. For example, the planner of a community might forecast a population of 80,000 for 1965 as compared to a 1950 population of 100,000 assuming that the neighboring mines were to be depleted by that time, that no new industries could be attracted and many of the old ones would be closed down, that the birth rate would fall, that new job opportunities would be available in other parts of the country, that no new medical discoveries would prolong the life of individuals, etc. However, he might also forecast a population of 100,000 for 1965, assuming that the mines and related industries would be partially in operation, that the area could attract new residents because of its scenic and recreation assets, that the health facilities of the area would be improved, lengthening the life of residents, that there would be a slight increase in birth rate due to the influx of young families with an economic future in the community, etc. There are many possible combinations of alternatives. The planner may usually want to present several sets of the assumptions he considers most feasible. However, the planner may want to indicate a single population forecast as the population which to the best of his judgment is to be expected. Too many, and too wide a range, of population forecasts may be as meaningless as no forecast at all.
Steps in Projection Procedure
DETERMINATION OF EXTENT OF AREA
The planner must determine the area for which he is planning. Population projections may be confined to the anticipated number of persons who live in the political jurisdiction or may include the "sphere of influence" of the political jurisdiction. In either case, assumptions must be made about the particular area under study in relation to the larger whole, — the region, the state, the nation, or even the world. For example, whether forecasts for a city are confined to the persons expected to reside in the incorporated boundaries of the city, or whether they are projected for the city and its fringe or metropolitan area, assumptions will still need to be made about the numbers and characteristics of persons who will live in the central city, in the suburbs, in that section of the nation, etc.
PROJECTION DATE
The next step in the analysis is setting a date to which population is to be projected. Although attempts at projection of national figures have been set far into the future (25 to 50 years) this is much more difficult for a smaller area, since the extremely unpredictable element of population shifts between regions must be confronted, an element which can be ignored in national projections. Generally the smaller the area to be covered, and the longer the time of projection, the more precarious the forecast. Therefore, it seems advisable, if possible, to restrict serious projections to a short period of time, perhaps ten or twenty years — with forecasts for later periods being added with decreasing reliability. However, since decisions must be made for facilities and services which may have a life longer than ten or twenty years, it may be necessary to compute population projections for a longer period. The PLANNING ADVISORY SERVICE Information Report for July 1950, "Cemeteries and the City Plan," illustrates some problems involved once land use patterns are "solidified." As mentioned above, alternative population projections should be made, particularly if the population forecast is being made for a period longer than ten years in the future.
ANALYSIS OF CURRENT POPULATION
The next step is the analysis of current population so that the characteristics of future population may be assessed. In making a population estimate, the planner is not interested merely in how many people will be in his area in 1960 or 2000, but what kind of people they will be, in terms of age, sex, race, income. It is assumed that the planner will utilize population data collected by the U. S. Census which is available for many different sized areas — including groupings of residential blocks (census tracts) within large cities. Census data give information inter alia on age, race and sex classifications and characteristics of the labor force, all of which will be relevant at some level of the projection procedure.
The chief defect of census figures is that since the census is taken only every ten years, the data decrease in accuracy later in the decade. The Bureau of the Census does conduct sample studies of changes in the nation and of specific areas between censuses. These studies will be of general interest but in most cases the planner may need to supplement decennial census data from local sources. Some states, such as Massachusetts, conducted population studies at the mid-point of the decade. The number of births and deaths are generally available from official city or state records of vital statistics. The number of households may be discovered through the records of the utilities companies. It is more difficult to obtain age and sex figures, although approximations and trends can be discovered from various agencies. School attendance figures are, at least in urban areas (and where available), a guide to changes in the school age population. The United States Employment Office issues social security cards to newcomers into the labor force. Migration figures can perhaps be estimated from the record of real estate offices, transportation agencies, telephone and utility companies. Although it is imperative that local resources be utilized between the decennial censuses, the 1950 U. S. Census preliminary reports have indicated that in many instances local figures were inaccurate, erring mostly by having overstated the local population.
A comparison should be made of current population data with that of the previous decades. In the study of the relationships between present and past data, trends may be discovered. For example, there may be a clear indication of an increasing number of older persons in the community. In determining a trend, care must be taken to see that the base period is selected properly, and that depression and war-time considerations are taken into account. A trend should be used in the study only if the reasons for its existence are known. There is a danger of trying to see trend relationships which do not really exist and to project trend lines which are incorrect and misleading.
For example, using the late 1930's as an illustration of the base period, a trend of increasing marriages and birth rates can be shown since the early 1940' s, — a trend or "baby boom" which is still continuing. Projecting such a trend would indicate a large increase in births in the future. If birth rates or the number of births in the last 50–75 years are charted, however, the optimistic trend (indicated above) is seen as an upward hump in a trend that is generally headed downward. A decision must be made as to whether a new trend is emerging, or whether the longer base period should be used and there is an upward hump in the former trend.
ANALYSIS OF POPULATION CHANGE
Current population data are merely a base point from which to begin the projection process, and our primary interest is in population changes. There are three main sources of population change which the planner must take into consideration: (1) fertility and mortality, (2) in- and out-migration, and (3) annexation of territory. Only the first two will be discussed in this report, since the annexation process is an administrative device that does not affect population change per se but only alters the political divisions in which population is counted. Fertility rates are expressed in ratios of the number of live births to 1000 population, and mortality rates are expressed in ratios of the number of deaths per 1000 population. Various measurements of these rates are explained briefly in the next pages. Since these rates are statistical devises for communicating information, the various types should be labelled carefully and examined for content, similar to labelling and interpreting an "average" to be the mean, mode or median. When fertility and mortality rates are projected into the future, many assumptions must be made. The section on "Factors Influencing Population Change" indicates some of the assumptions, and their implications, which are inherent in projection of fertility and mortality rates, and are inherent in estimates of migration.
MEASUREMENT OF FERTILITY
In population projection, it is necessary to anticipate the number of persons who will be born and will survive to replace the present generation. There are a number of measurements of birth rates. Probably the most widely used has been the crude birth rate or the number of live babies born in anyone year per 1000 of the total population. A refinement of the crude birth rate is the specific birth rate, which is defined as the number of births per 1000 women of child-bearing ages (15–49). If the number of women of child-bearing ages changes, the number of births will be affected. For this reason, the specific birth rate is more useful than the crude birth rate. Since birth rates differ for women of different ages (rates are highest for the 20–24 and the 25–29 age groups), it is advisable to use a further refinement for projection purposes — the age-specific birth rate, or the number of births per 1000 women of different age groups.6 An illustration of the procedure which may be used for projection purposes follows:
Information on the number of births, the age of the mothers, and the number of married women of child-bearing age, is available from census data and vital statistics data. A table can be constructed showing how many children were born to 1000 women of each of the age groups from 15–49. This may be done for a number of previous years to reveal trends of births for the particular area. The next step is to make assumptions about the continuation of these birth rate trends. (See the section "Factors Influencing Population Change.")
Fertility figures are generally computed in five year periods. After presenting data in tabular form and analysing the data for trends, and analysing factors affecting population change, it was assumed in a fictional area that the birth rate per 1000 women, age 20–24, would be 150 per year for the years 1950–54. If there were 5000 women in that age group in 1950, a birth rate of 150 would mean that 750 children would be born to this group in 1950, and for the period 1950–54, five times that amount, or 3750. This assumes, however, that the number of women in the group remains constant, which it does not. Some of the women will have died by the end of 1954, others will have been added or subtracted by in- or out- migration. The population must be "survived" — i.e., "corrected" for the number expected to die. Assuming that there is a mortality rate of 2 per 1000 for women of this age-group who will die before they could bear children, 50 women would die during the five year period. This figure should be subtracted from the total number of women in this age group. Assuming that there was an annual net in-migration of 50 women in this age group, the anticipated births must be computed and added to the previous total. The computation steps are illustrated in the following table.
TABLE I
AGE-SPECIFIC BIRTH PROJECTION FOR SINGLE AGE GROUP
Age Group: 20–24, Period: 1950–54
| COMPUTATION OR SOURCE | ||
|---|---|---|
| (a) Number of females in 15–19 Age-group in 1950 | 5000 | (U. S. Census, 1950) |
| (b) Mortality rate of female 20–24 Age-group | 2/1000 per year | (Previous local vital statistics) |
| (c) Surviving females at end of 1954 | 4950 | (a) - (5x (a) x (b)) |
| (d) Average number of females in group, 1950–54 | 4975 | (a) + (c) / 2 |
| (e) Child–bearing rate of 2024 Age-group | 150/1000 per year | (Previous local birth records) |
| (f) Children born to Age-group, 1950–54 | 3731 | 5 x (d) x (e) |
| (g) Annual net in-migration of females in 20–24 Age-group* | 50 | (U. S. Census and local records) |
| (h) Average additional females in Age-group from in-migration | 125 | 5 x (g) / 2 |
| (i) Children born to in-migrant females 1950–54** | 94 | 5 x (e) x (h) |
| (j) Total children, Age-group 0–4, added to population by age 2024 females during period 1950– 54*** | 3825 | (f) + (i) |
*This figure should be corrected for survival, similar to (c).
**This assumes the same child-bearing rate for in-migrants as for the existing population, an assumption which may be wrong, in view of the characteristics of the in-migrating population.
***This also would need to be corrected for survival before it could be added to the total population.
These types of computations should be made for each age group in the potential child-bearing population, and for successive periods of time. For example, for the years 1955–59, the former 20–24 age group will be the 25–29 age group. Adjustments must be made for migration, and again the population must be "survived" — i.e., adjusting for the number of women who will be likely to die within the period.
If the number of past births related to the age of the mother is not known, and if assumptions cannot be made as to the age-specific birth rates, it will be necessary to use the specific birth rate. This would mean that the number of births per 1000 women age 15–49 would be calculated, adjusting for the number of women who will be expected to die and to in- or out-migrate. It is, of course, desirable to compute differential birth rates not only for different age groups but also by other population characteristics such as income, race, religion, etc. The following table illustrates the differences in birth rates for native white and nonwhite women of different age groups.
TABLE II
BIRTH RATES FOR NATIVE WHITE AND NONWHITE WOMEN IN THE UNITED STATES, 1945*
| Age Groups | Native White | Nonwhite |
|---|---|---|
| 15–49 (Total) | 76 | 100 |
| 15–19 | 43 | 131 |
| 20–24 | 133 | 179 |
| 25–29 | 135 | 134 |
| 30–34 | 100 | 94 |
| 35–39 | 56 | 70 |
| 40–44 | 16 | 20 |
| 45–49 | 1 | 3 |
* From Forecasts of the Population of the United States 1945–1975 (See Bibliography in Appendix B)
MEASUREMENT OF MORTALITY
Mortality rates are usually expressed as the number of deaths per 1000 persons in the population for any one year (this is the crude death rate). PLANNING ADVISORY SERVICE Information Report No. 16, "Cemeteries in the City Plan," illustrates in Table II, the method of computing crude death rate figure for a population. Sometimes mortality rates are expressed in ratios of deaths to the number of persons in different age groups of the population. The more "refined" the death rate, i. e., the more detailed information that is available on the relation of deaths to sex, age, racial, income and other characteristics, the more useful it is as a tool for forecasting future population, The Table below illustrates the differences in death rates for different ages and sex groups:
TABLE III
DEATH RATES OF WHITE PERSONS AT SELECTED AGES, BY SEX, FOR THE UNITED STATES: 1940*
| Age | Male United States Rate | Female United States Rate |
|---|---|---|
| Under 1 year | 50.6 | 39. 1 |
| 1–4 | 2.8 | 2.4 |
| 5–9 | 1.2 | 0.9 |
| 10–14 | 1.1 | 0.8 |
| 10–24 | 2.4 | 1.7 |
| 30–34 | 3.2 | 2.5 |
| 40–44 | 6.3 | 4.4 |
| 50–54 | 14.3 | 9.3 |
| 60–64 | 31. 6 | 21.5 |
| 70–74 | 70. 1 | 55.8 |
* From Forecasts of the Population of the United States 1945–1975 (See Bibliography in Appendix B)
The number of persons expected to die within a certain period of time must be subtracted from the total number of persons. The process of "surviving" the population, which was illustrated in the section on measurement of fertility, indicates the number of each age group (and preferably other characteristics) that will die within a period of time. For example, if there are 10,000 persons in the 20–24 age group, half of whom are males, it could be expected (using the above table as an illustration) that 12 males would die each year, or that 60 would die in the five year period. During the same five year period, 43 females of this age group would be expected to die. There would thus be 4940 men and 4957 females entering the 25–29 age group five years later (neglecting in- and out-migration).
Mortality rates will differ in different sections of the city. High rates are likely to be found in areas populated largely by foreign born, and low rates are likely in the suburbs which are populated by young people. If statistics are compiled by geographic areas, the relationship between the characteristics of the area and the population should be discovered. For example, it is not uncommon to find that a hospital will "skew" (alter) the expected number of deaths (and births) for a particular area. Areas with little residential development may also reveal "abnormal" rates.
Thompson and Whelpton concluded that the death rate in the United States would in the next half century with further applications of scientific knowledge, reach the biological minimum, at least for the white population. (Claims have been made, however, that man's span of life may be lengthened to 100 or more years.) They expect some decrease in the death rate for infants and young children, with fewer changes for all other age groups.
The present low death-rate holds for people in the upper and middle socio-economic brackets. If increasing national prosperity can be maintained, and low income groups achieve higher standards of living, decreases in their death rate will also soon be achieved. The same is true of non-white people, especially Negroes, whose shorter life expectancy today is largely due to sub-standard living conditions. If a city has a large group of people living in sub-standard conditions, and the city has made plans to improve these conditions through better housing, and through the presence of well-paying jobs, it may be expected that greater numbers of people will live longer. Similar changes can be expected if infant care is currently deficient and can be expected to be rectified within the time for which population forecasts are made. The death rate of the city will increase if it is now or is likely to become a center for in-migrating older people. Some warm-climate "retirement" localities may be expected to show a death rate higher than that for the nation as a whole.
The standard of living as it affects lower income groups, the presence of abnormally large number of older people or infants, or people with short life expectancies, improvements in infant care and disease prevention are factors that influence the death rate. Unpredictable factors, like war or other disasters, would, of course, drastically affect death rates. Although the planner cannot predict whether such calamities will take place, he should be aware of their possible effects.
MIGRATION
A major source of population change is migration. The student of national populations is not concerned with movements inside the country, but only with immigration from other countries. Since it is generally felt that barring major world catastrophies, or changes in national policy, the present rigid immigration laws will not be relaxed, national in-migration may be assumed to be rather small. On the local level, however, in- and out-migration is important.
There have been few studies of residential movement, but one of the chief causes for migration from or into an area is the presence of jobs. It is easy to over-estimate labor mobility, because it may be forgotten that it is expensive and difficult to move and that many people dislike breaking up friendships and other social ties. But at least one of the reasons for the western migration that has been taking place has been the presence of jobs. It was estimated that 19.5 million persons made major moves during World War II (other than intra-city moves, and excluding members of the armed forces). One of the major causes of the movement from farm to city has been the mechanization of agriculture, the few jobs on farms, and the lack of other job opportunities in rural communities. A reverse movement was noted in the depression, when unemployed workers returned to farms, seeking a means of livelihood. There is less likelihood of this recurring in future depressions due to the institution of unemployment compensation payments with residence restrictions.
The relationship of economic opportunity to migration is one reason for the recognition of the need for economic analyses to accompany population studies. A proper assessment of the economic status and the possibilities of the area will facilitate the making of assumptions about migration. The industrial city of Flint, Michigan, has recognized this problem. A population projection made for this city by Robert C. Schmitt, under the auspices of the University of Michigan, concluded:
"A leading General Motors executive has stated that his organization expects yearly automobile production. . . . to level off. . . sometime after 1950. Therefore, unless Flint attracts other types of industries, which is doubtful (because Flint is a one-industry city, wage levels are high, and labor is highly organized and its location is not advantageous to national or commercial ventures), its job opportunities and hence population will expand only moderately after 1950. . . " The Future of Metropolitan Flint (p. 25–26).
The planner must, therefore, evaluate the employment situation for future years in order to make any assumptions about future migration. If the area is one, like the Pennsylvania anthracite area, which may be faced with a declining industry in the near future, and there is difficulty in attracting new industries to the area, a decreasing population may be anticipated. Since it is usually the young and ambitious who move out first, the fertility rates will be affected as will the age composition of the population.
If there are no employment possibilities for an area, eventual out-migration may cause a city to become a "ghost town", as has happened on the American frontier, in New England, and in one-industry communities. Conversely, if an area is particularly suitable for a new industry, and there is an above-average chance of getting such an industry, in-migration may be expected. The type of labor required by a new industry should be studied to see from what locations and population groupings the additional labor will come. Perhaps a metropolitan factory is decentralizing into a smaller town, and will attract skilled men from other communities. If they are young men with families the population composition of the town will change one way; if they are older men, it will change another. Such changes are most clearly seen in the smaller communities.
Migration factors are not all economic, however. Especially in periods of full employment and prosperity, the advantages offered by one area in general living conditions — community services, housing, recreation and park space, etc. will cause population movement. This is one reason for the exodus to California. It is also a major reason for the movement from the large cities to the suburbs.
Although the Bureau of the Census asks questions about migration between counties and states, and these figures are published, the planner will have to be ingenious to discover the current migration trends in his own area. There are various sources where information about in- and out-migration may be discovered. Railroads, real estate agencies, moving and express companies, employment offices, utilities (especially water and electric companies), telephone offices, and social agencies, are the type of agencies that come in contact with people who are leaving or entering an area.7 Community leaders, preferably those of informal organizations, should be consulted on the question of how people feel about their neighborhoods; this is a valuable device for charting potential migration from a neighborhood. The type of information that can be gathered from these sources will not be statistically precise, but it will be helpful in giving insights in the difficult task of making assumptions about migration.
Assumptions should be based on what is known about previous and present migration trends in an area. If economic and community studies indicate that the factors behind these trends are still applicable, anticipated migration may be based on projection of these trends. In most areas, however, the war period changed all previous migration trends, and it will be necessary to newly assess the area's potential economic situation in the national scene.
FACTORS INFLUENCING POPULATION CHANGE
The most exacting and complex of the steps in population projection is that of identifying and assessing the probable influence of the many factors affecting the numbers and types of persons who will be born and will die, and will move during a period of years, A few of the major factors — the rate of industrialization and the socio-economic differences in population habits, have already been mentioned in the introduction of this paper. A multitude of factors, national and local, sociological, psychological and economic, must, however, be considered. It is impossible to list all or even a large part of these factors.8
"THE STYLE OF LIFE"
The planner must consider and be observant of what might be called the "style of life." This includes the way people live, their daily routine, the things they like to do in their leisure time, etc., and most important, how this relates to having children. The busy apartment dweller, the clubwoman, the career woman, may not want to rear a large family, because the care of children interferes with other activities. The workingman, whose wife has to work, may postpone his family until he can support one through his own wages. People living in suburban areas may have a two or three child-family, partly because of more social pressures, perhaps because of more amenities for child-raising than in crowded cities. The tendency in some parts of the population has been to marry at an earlier age than twenty years ago, and the five or six years difference in length of marriage may mean an extra child in the family. The farmer who formerly wanted a large family to help him on the farm is now working with labor saving devices. The farmer's son may not like farm life or may be unable to find employment on the farm, and may leave for the city before he marries. As a city person, he may very likely have fewer children than as a rural person.
IDENTIFYING AND DESCRIBING THE ATTITUDES AND HABITS OF DIFFERENT SOCIO-ECONOMIC GROUPS
The planner, in trying to understand the different "styles of life" of the persons residing in the area for which he is planning, may find it helpful to divide the area into "communities." This division would assume that there are easily identifiable groupings of homogeneous people, who for one reason or another, reside in close proximity. These clusterings of persons with similar minority, religious, national or social backgrounds, have existed, as sociological studies of W. Lloyd Warner and others have indicated. Ecological studies, such as those made by Dr. Ernest Burgess, will help in determining the developmental pattern of a community.
The Chicago Community Inventory, for example, has divided Chicago into about 50 communities for statistical presentation and analysis. The divisions were made on the basis of the boundaries generally accepted, talked about and used by the people living in an area. The Buffalo City Planning Commission's report, "Looking at Buffalo's Population in 1975" divided the city into communities with "boundaries having been drawn with future public facilities and service areas in mind." Forecasts were made for the future population of the sections of the city as well as for the city as a whole.
The process of identifying, studying and analysing the existing characteristics and attitudes of different groups in the population is a very valuable one in the understanding of a community. However, the homogeneity of specific sections of a community should not be overemphasized. Merely because a majority of people in a particular section have similar backgrounds does not mean that they will have similar attitudes or behavior patterns. Also, many areas are "in flux" and a section of a community that may be identified, for example, as predominantly white, middle-class, native born, protestant, young adults with high-school education and "white-collar" jobs may within a few years change completely in income-level, educational, national origin, religious and other characteristics.
Although it is not recommended that main reliance be placed on making many "individualized" projections of population for specific areas within a community, it is recommended that projections for the entire area be made on the basis of classifications and groupings of the population. In the interpretation of these classifications, the planner will need to be aware of possible changes from past behavior due to the effects of urbanization, Americanization, and increased income. For example, if a community has a large, lower-class foreign born population, the planner may expect these persons to have large families, but he should think in terms of a decrease in the number of children born to the second generation.
ECONOMIC CONDITIONS
A major factor that affects population trends is generally referred to as "economic conditions". This includes conditions both at the national and at the local level. One of the effects of the depression of the 1930's was a postponement of many marriages of middle-class persons and the continuance of childless ones, just as postwar inflation helped marriage and birth rates reach a new, and perhaps temporary, high. Both extreme depression and prosperity periods encourage large scale migration within the country, as people on the one hand are motivated to find any type of livelihood, and on the other, are motivated to find a "better" job.
A generalization that has been applicable for a number of years is the inverse relationship between fertility and income. The fertility rates of lower economic groups have been higher than those of middle and upper income classes. High fertility among non-whites is explained by the fact that most non-white persons have been in the lower economic classifications.
In estimating anticipated future population and making assumptions about birth and death rates and in- or out-migration, the planner must make assumptions about the economic conditions of the locality and of the nation. He must also make assumptions about the relationship of economic conditions to population. For example, an improvement in sanitary facilities and in diet and in income level for the Negro might result in a lowered death rate for this group, but perhaps also a lowered birth rate (as the Negro adopts the values of a higher income group). Experience has shown, however, that there is a substantial lag in time between an improvement in death rate and the compensating decrease in birth rate.
FACILITIES, SERVICES, AMENITIES
Economic conditions, reflected in terms of the facilities and services offered by a municipality, will affect future population. The presence of well-run nursery schools and child-care centers, of safe parks and playgrounds, and of pleasant, inexpensive, and spacious housing accommodations may attract families with several children apiece, or couples who want to raise a large family. If economic conditions permit it, there may be a migration of families with many children from areas lacking these amenities. (On the other hand, slum dwellers are still raising large families, and will no doubt continue to do so until birth control methods are accepted, understood, and used.) If adequate facilities are not present in the city, the planner may expect a proportion of young people to move to suburbs and satellite areas where larger families may be raised more comfortably. Sufficient research has not been done to relate facilities, services, and amenities to length of life. It has been postulated by some that the lack of planning (one evidence of which would be long and wearying commuting) causes tension in persons which in turn shortens the life span. Also, as another type of example, safety innovations in traffic and transportation movements would minimize accidental deaths.
POSSIBLE INFLUENCES
The planner must also think in terms of future factors. One may speculate whether a decrease in the work week, and the corresponding increase in leisure time will stimulate family-centered activity, and in this way increase family size. Changes in social attitudes might have implications on population size. If there were no social stigma attached to the children of unmarried mothers, an increase in the number of births would be a possibility.
NATIONAL POLICIES
Another series of factors might be grouped under the heading of national policy. Policy changes in regard to immigration, social security in its broadest sense (health, education, or unemployment benefits), encouragement of larger families through subsidies for children, all play a role in determining the future population. Such policies are themselves effects of other population pressures; for example, the presence of a predominantly larger number of older people in the population may lead to a demand for subsidizing families who produce infants, so that there will be enough children to replace the population and fill in the lower age brackets. If the nation engages in war, there will be profound changes in death rates, and also in birth rates (not only during the war, when birth rates may soar in places where soldiers are stationed, but also the long-term after-effects of births being dependent upon survivors).
Examples of Population Projections
Combining mortality, fertility and migration estimates to derive the final population estimate or estimates demands the exercise of good judgment. There are a number of methods which may be employed in population projection; the Cincinnati study of December 1945,9 is given here as an example. This study, directed by Dr. Warren Thompson, used somewhat the same methods employed by Thompson and Whelpton in estimating the national population. (See page 6-7.) Using five-year intervals, an estimate was made for each five year period from 1940-1970 for how many people would survive from the previous period, and how many would be added to the population through births and in-migration.
Age, race and sex data for the Cincinnati population in 1940 were available from the U. S. Census. Death rate figures for the different age groups for the years 1939 and 1940 were available locally and so it was known that of persons aged 0–4, 5–9, etc. a given number per 1,000 died during a year. Drawing on knowledge of the Cincinnati population, and on material assembled by Thompson and Whelpton (see bibliography) about the trends in death rates for men and women and for different economic groupings, the staff assumed specific death rates for the next five years, and "survived" the existing population of the area.
In addition, data on births were available that could be grouped into "age-specific birth rates" — how many children were born to 1,000 women in different age groups. For example, in 1939 and 40, 1,000 white women age 15–19 had borne 54 children per year, while those aged 44–49 had only one or two. Knowing past patterns for all age groups of potentially fertile women, assumptions were made about the birth rate for the next five years and for later years. Although only one assumption was made about death rates (since mortality rates do not fluctuate excessively except in case of war and other disasters), three different sets of assumptions were made about birth rates. The high estimate was made on the assumption that birth rates would increase in relation to the base period (1939–40) partly due to the influx of war migrants into the area, The medium estimate assumed the rates would remain the same as in the base period; the low estimate assumed that the tendency of decreasing birth rates would continue, and there would be fewer births per 1,000 women in the next five years. After making these birth rate assumptions, the number of children that could be expected to be born between 1940 and 194510 were computed. This number, after being" survived," was added to the previous computations.
There were now three sets of projections; one for mortality and high birth rates, one for mortality and medium birth rates, and one for mortality and low birth rates. The final source of population change, migration, was estimated as follows. Knowing that migration assumptions are extremely difficult to make since they are based on so many factors, the study did not attempt to say how many people would enter the area in the five year interval. Instead it defined a unit of in-migration, a group of 5,000 in-migrating persons distributed by age, sex and race in proportions as similar as possible to those of "normal" in migrations (before the war). It was then assumed, for illustrative purposes only, that one unit would enter the area in the next five years, not because this was expected to happen, but only to show how the population would be distributed if 5,000 persons entered the area. The in-migration procedure is open to two criticisms. First, it might be said that although migration data are hard to project, it might just as well be attempted as using an illustrative figure of 5,000 or 10,000. Second, basing the age-sex distribution of the in-migrating (or out-migrating) population on prewar trends is assuming that prewar conditions will return in a post-war era.
The number of in-migrants in each age group was then added to the previously calculated projections. (A projection based on the assumption that 2 units, or 10,000 people would in-migrate was also made). This gave adjusted population projections for the year 1945. The same process — surviving the 1945 population until 1950, adding births, (less infant deaths), and adding one or two units of migration — was then followed for five year intervals, up to 1970, the final year of projection. The conclusions of the study were that without migration, Cincinnati would increase in population till about 1955, when it would begin to decrease. With one or two units of migration added each five year period, it was felt that the population would continue to increase. The table, reproduced below, indicates the variations of projections based on different assumptions for the years 1950 and 1970:
TABLE IV
CINCINNATI: 1950 & 1970 PROJECTIONS BASED ON DIFFERENT ASSUMPTIONS ABOUT BIRTH RATES AND MIGRATION
In Thousands of Persons (to the nearest thousand)
| BIRTHRATE | NO MIGRATION | ONE UNIT OF MIGRATION | TWO UNITS OF MIGRATION | |||
|---|---|---|---|---|---|---|
| Year | 1950 | 1970 | 1950 | 1970 | 1950 | 1970 |
| High | 475 | 468 | 480 | 501 | 486 | 534 |
| Medium | 464 | 442 | 469 | 474 | 475 | 506 |
| Low | 455 | 422 | 461 | 453 | 466 | 485 |
The 1940 population of Cincinnati was 455,610. The 1950 population was reported as 499,749, which compares to a 486,000 figure which was the "high" (high birth rate assumption plus two units of migration) anticipated by the 1945 study for 1950. This comparison illustrates the difficulty in making population estimates.
Broome County, New York used a similar but more simplified procedure than Cincinnati. One year rather than five year intervals were employed in computing projections. The number of people surviving each year was calculated although this was not distributed by age groups. The rate of natural increase, or the number of births less the number of deaths per 1,000 people of all ages was utilized to indicate future population. The rate of natural increase was assumed from birth and death rate trends in the area since 1930, and from national estimates of future trends. Starting with the 1949 rate of natural increase of 13.7 per 1000 persons, a higher of two estimates assumed this figure would decrease rather sharply until 1954 when it would stabilize at slightly over 9.0. The lower natural increase rate estimate assumed that the stabilization would be at 6.0.
Using a New York State Department of Health estimate of the 1949 population, the rate of natural increase was multiplied by the total population figure to give the number of persons added because of the excess of births over deaths. This was added to the 1949 population estimate.
To that figure was also added in-migration assumptions, based on previous trends, and the possibility that there might be increasing in-migration. Two assumptions, of 900 and 1,800, were therefore computed, and added to the above. There were thus four projections, based on: (1) higher natural increase with 900 in-migration, (2) higher natural increase with 1, 800 in-migration, (3) lower natural increase with 900 in-migration, and (4) lower natural increase with 1,800 in-migration. The 1950 assumed natural increase; and assumed in-migration figures were added to the 1950 figures to give the probable 1951 population. This procedure was repeated, as in the Cincinnati study, but by one year instead of five year intervals until 1970.
To forecast age-sex groupings it was assumed that the relationship they had established between Broome County and United States figures would continue. The Thompson and Whelpton predictions for age and sex groupings in the country were used for computed figures for Broome County. The assumption made in the latter method that similarity between county and national figures would continue is not to be recommended; there is no inherent reason why such a relationship should continue for another 20 years. A few years of atypical migration would invalidate the entire projection.
This same approach was used by the Flint, Michigan, study mentioned previously, wherein a relationship was found between trends in United States durable goods manufacturing employment and the Flint area labor force. Flint population figures were projected into the future on the basis of future national trends. Without knowing the reasons for this relationship one cannot assume its continuation in future years.
Conclusions
It cannot be over-emphasized that there are many varied factors influencing birth rates, migrations, and to a lesser degree, death rates. Unfortunately, much of the research necessary to isolate these various factors and to appraise their effects remains to be done. The planner in forecasting future population for his area may seek the aid of a demographer especially trained in the technical study of population. However, the planner must work closely with the demographer to constantly relate planning considerations to statistical manipulations. The planner, with his knowledge of the area and study of its economic potentialities and his proposals for future densities (and distribution of these), has insights into the developmental pattern of a community, which the demographer lacks.
Population projections, like master plans, must be revised quite frequently. It has been suggested in this report that several alternative projections be made on the basis of different sets of assumptions. It has also been recognized that in the last analysis, the planner must use as a working guide that population projection he considers most feasible. In making population projections, the planner need not be so much worried about errors in forecasting the numbers of persons (a five percent under or over-estimation of population should not disrupt a community!) but he should be concerned about an error in the kinds of anticipated persons. For example, in a community of anticipated 100,000 population, 5,000 additional persons could be absorbed; if all 5,000 additional persons were children of school age, however, the effects on community facilities might be disastrous.
There is no easy method to population forecasting. Some demographers feel that fertility and mortality rates are nearing some sort of stability. Should this actually happen, a series of formulae might be developed by which fertility and mortality might be projected, leaving migration as the field for most intensive scrutiny. The "stability" does not yet exist. Given though the planner of today must resort to "enlightened guesses", he must be aware of the many complex interacting forces that influence future population numbers, composition and place of residence.
ENDNOTES
1 These stages of population growth are presented in Frank Notestein's "Population – The Long View." See Bibliography in Appendix B for complete reference.
2 The knowledge, much less the practice, of birth control varies in different social and economic groupings.
3 Throughout this report, the city is used for illustrative purposes. However, the procedures mentioned are applicable to other types of jurisdictions and areas.
4 The method of forecasting a future population for a small area from projections for the future population of a large area is meritorious in that assumptions for over-all social and economic conditions are made, and large scale changes may be taken into account. It has been used in Population Estimates 1950–2000, a study of the Philadelphia–Camden Area, Philadelphia City Planning Commission, 1948, and is of more value to a large city than smaller ones. Smaller cities (under one million population) cannot as easily be compared with regions, and the country, as a metropolis like Philadelphia, simply because the former are less representative than the latter.
5 Estimates of Future Population of the United States 1940–2000, U. S. National Resources Planning Board, Washington 1943; and Forecasts of the Population of the United States 1945–1975, U.S. Bureau of the Census, Washington, 1947.
6 Two other measurements of fertility are the gross reproduction rate and the net reproduction rate. The "gross reproduction rate" is a "two-generation" concept or a ratio of the number of girl babies that will be born a generation later to a population of new-born girls, assuming that age-specific birth rates remain unchanged, and assuming further that none of the present new-born girls die before they reach the end of their child-bearing period. The "net reproduction rate" is the "gross reproduction rate" corrected to account for the number of new-born girls who are expected to die before they bear girl children. Assumptions about the age-sex distribution of a theoretical population are inherent in these measurements. Therefore, it is difficult to use these measurements in the projection of an existing population with an age-sex distribution differing from the theoretical "standardized" one.
7 Analyzing issuance of building permits is a useful device for estimating new households in small areas.
8 A good discussion of some of these factors may be found in Warren Thompson's Population Problems, especially Chapters 4, and 9–12 of the second edition, and Parts I and II of Population Problems by Paul H Landis. (See Bibliography.)
9 Population, Metropolitan Master Plan Study, City Planning Commission, Cincinnati, Ohio, December 1945.
10 Birth figures taken from 1940 Census data had to be adjusted upward to account for births which were not enumerated or registered.
APPENDIX A
A graphic illustration of the steps taken to estimate future population. From The Population of Philadelphia and Environs. (See Appendix B)

APPENDIX B
SELECTED ANNOTATED BIBLIOGRAPHY
This bibliography lists some references of interest to the planner concerned with population projection. It is divided into 3 parts; the general section includes references which discuss and introduce the problem of population study. The section on methods consists of articles dealing with projection techniques. The section on reports lists some reports published for national, state, county and city areas; many of these contain chapters on projection methods.
GENERAL
POPULATION PROBLEMS. A Cultural Interpretation, Paul H. Landis. American Book Company, New York; 1943, 500 pp. tables, charts.
As the title implies, this volume emphasizes the sociological and cultural aspects of population problems. Parts 1 to 3 deal with the causes and factors relative to present population distribution and growth.
POPULATION PROBLEMS. Warren S. Thompson. McGraw-Hill Book Company, Inc, New York; 2nd Edition, 1935, 499 pp. tables, charts.
Probably the best known work on the theory and problems of population. Major emphasis is placed on urban population problems. Has bibliography for each chapter, and contains many charts and illustrative tables.
PLENTY OF PEOPLE, The World's Population Pressures, Problems and Policies, and How They Concern Us. Warren S. Thompson. Ronald Press Company, New York (Humanizing Science Series); 1948, 281 pp. tables, charts.
A brief version of POPULATION PROBLEMS, written for the layman, and without the bibliographic references.
POPULATION — THE LONG VIEW. Frank W. Notestein, in T. W. Schultz, Food for the World, University of Chicago Press, 1945, pp. 36–57.
An excellent brief statement of the three major population growth stages, and of population trends in industrial society in the last two centuries. This is a basic reading.
PROJECTION METHODS
LOCAL PLANNING ADMINISTRATION. The International City Managers Association. 1313 East 60th Street, Chicago, Illinois; Second Edition, 1948, pp.67–79.
A brief review of good and bad population projection methods.
POPULATION ANALYSIS FOR PLANNING SMALL AREAS. Robert C. Schmitt. Current Population Reports, Series P-25, Department of Commerce, Bureau of the Census, Washington 25, D. C., 1950.
A brief article discussing some of the problems facing the planner in population analysis. Suggests methods for current and future estimates and advocates "zonal analysis."
POPULATION FORECASTING FOR PLANNING PURPOSES. A. A. Heath, in Journal of the Town Planning Institute, January–February 1948, pp, 41–51. charts, tables.
An almost entirely graphical method of projection, with a discussion of procedure, and illustrations of standardized forms used in estimation. There is very little discussion of the assumptions involved in the approach.
THE SOCIAL AREAS OF LOS ANGELES. Eshrev Shevky and Marilyn Williams. University of California Press, Berkeley and Los Angeles; 1949, 172 pp.
A controversial study which divides Los Angeles into social areas based on factors that are also relevant to population projection.
STABILIZED METHOD OF FORECASTING POPULATION. Bernard D. Karpinos, in Public Health Reports, United States Public Health Service, Vol. 54, No. 40, October 6, 1939, pp. 1807–1822. Government Printing Office, Washington 25, D. C.
An approach based on stabilized mathematical formulas; for the qualified statistician only.
STATISTICS FOR SOCIOLOGISTS. Margaret Haggood. Holt and Company, New York; 1941, Part 5 "Selected Techniques for Population Data."
An introduction to the concepts, techniques, and mathematics of population enumeration and projection.
POPULATION PROJECTION STUDIES
BASIC ASSUMPTIONS AND FACTORS CONSIDERED IN ESTIMATING INCREASES OF POPULATION; LABOR FORCE AND EMPLOYMENT IN THE PACIFIC COAST STATES, 1948-60. Pacific Coast Board of Intergovernmental Relations. 121 Federal Office Building, San Francisco, California; January 1949.
The title is self-explanatory; it is a study of the factors that have to be taken into consideration when making a population projection. The emphasis is on economic factors. Outlines the problems that have to be studied.
ESTIMATED RANGE FOR POPULATION GROWTH IN CALIFORNIA TO 1960. State Reconstruction and Reemployment Commission. 631 J. Street, Sacramento, California, November 1946. 54pp. tables, charts.
A study of population growth in the state, and parts of the state. Also includes a study of the increase in numbers of families. No discussion of methods.
ESTIMATES OF FUTURE LONG-TERM TREND OF POPULATION GROWTH IN THE PHILADELPHIA-CAMDEN INDUSTRIAL AREA 1950–2000. Planning Study No.1, Philadelphia City Planning Commission. Philadelphia, Pennsylvania; April 1948, 20pp. tables.
The long-term projection is made by comparing area growth trends with those of United States total population, United States urban population, and Northeastern Industrial Region urban population, and projecting area trends into the future. The study is based to a large extent on the national projections of Thompson and Whelpton.
ESTIMATES OF THE FUTURE POPULATION OF THE UNITED STATES, 1940–2000. Warren S, Thompson and P. K. Whelpton. U. S. National Resources Planning Board., Government Printing Office, Washington, D, C., 1943, 137 pp, charts, tables, Price 35¢.
FORECASTS OF THE POPULATION OF THE UNITED STATES, 1945–1975. U. S. Department of Commerce, Bureau of the Census; U. S. Government Printing Office, Washington, D. C., 1947, 113 pp. charts, tables.
The two references listed directly above are basic texts for illustration of the methods used and for postulations about mortality, fertility and migration trends.
LOOKING AT BUFFALO'S POPULATION IN 1975. City Planning Commission. Buffalo, New York; April 1949. 24pp. charts, tables.
A report prepared for the general public. Interesting for its well-done graphs, and the projection for individual "communities" in the city.
NEW YORK CITY'S POPULATION GROWTH, 1790–1970. Economic Research Department, Consolidated Edison Company of New York; December 1946, 28 pp. tables, charts.
Useful for its discussion of factors and trends in relation to birth, death, and migration figures, both on the national and big city level. Also estimates population from the S curve and number of electric bills. Has bibliography.
PEOPLE, JOBS AND INCOME ON THE PACIFIC COAST, 1949–1960. Pacific Coast Board of Intergovernmental Relations. 121 Federal Office Building, San Francisco 2, California; 137 pp. tables, charts. 1949.
An example of a combined population and economic study. Population projections are made for California, Oregon and Washington.
POPULATION PREDICTIONS FOR BROOME COUNTY, Broome County Planning Board. County Office Building, Binghamton, New York; April 1950. 17pp. tables.
A simply written prediction report for a 160,000 population county. Uses analytic as well as a number of mathematical methods.
POPULATION STUDY OF MASSACHUSETTS, in Planning Forum, Massachusetts State Planning Board, Boston, Mass, Vol. II, No.4, March 1948. 29 pp. maps, charts, tables.
A state projection using specific birth and death rate, and migration analysis method. Tries also to project age-sex groupings into the future.
THE FUTURE POPULATION OF METROPOLITAN FLINT. Robert C. Schmitt. Institute for Human Adjustment, University of Michigan, Ann Arbor, Michigan; 1947. 30 pp.tables.
Interesting for its methods of estimating recent growth, present population, and comparison of projection rnethods. Uses correlation with employment factors and national economic factors as projection device.
THE FUTURE POPULATION OF PROVIDENCE. Publication No.1, The City Plan Commission of Providence, 3, Rhode Island; October 1945.
A 40-year projection. This study was prepared for the general public and lacks methodological sections. Some of the conclusions were elucidated and corrected following later studies. They are presented in Publication No.7, MASTER PLAN FOR PUBLIC SCHOOL SITES, March 1950.
THE POPULATION OF PHILADELPHIA AND ENVIRONS and LABOR FORCE AND EMPLOYMENT ESTIMATES, A PROJECTION FOR 1950. A report to the Philadelphia City Planning Commission, from the Population and Economic Research Advisory Committee under the Auspices of the Institute of Local and State Government, University of Pennsylvania. Philadelphia City Planning Commission, Market Street National Bank Building, Philadelphia 7, Pennsylvania, 1946, 84 pp. (42 pp. each), tables, charts.
A careful attempt at post-censal estimates of Philadelphia population, plus a 1950 projection based on methods similar to those described for Cincinnati. Methods used are described thoroughly. There is also a good discussion of assumptions concerning mortality, fertility and migration.
THE POPULATION OF THE CINCINNATI METROPOLITAN AREA, City Planning Commission, Cincinnati, Ohio, December 1945, 157 pp. tables, charts. Price $2.00
A complete study, with a chapter on the empirical and mathematical methods used. Includes an analysis by tracts of population shifts in the city area.
N. B. U.S. Bureau of the Census periodic and decennial publications are available from the Government Printing Office, Washington, D. C. See also Current Mortality Analysis, U. S. Public Health Service; and Statistical Bulletin , Metropolitan Life Insurance Company.
Copyright, American Society of Planning Officials, August 1950.