July 24, 2025
Earlier this year, Michael Rich, PhD, tried to determine whether the metro Atlanta area was reaching people eligible for workforce development programs. Was outreach happening too little or too much in some areas? Were other areas not targeted effectively?
Help came in the form of the Urban Institute's Spatial Equity Data Tool (SEDT), an open-source tool that puts equity at the forefront of its analysis.
At its core, SEDT compares location-based point data to five-year American Community Survey information to generate geographic and demographic disparity scores. Users can enter city, county, state, or national data into the web tool or use the application programming interface (API), which became available in 2024 and allows users to incorporate their own data tools.
"Even if you're not thinking about the tool through an equity lens, you can think about it through a simple program effectiveness lens," says Alena Stern, chief data scientist at the Urban Institute. "If you are designing a program, you want to make sure it's reaching its intended users."
In Atlanta, SEDT is helping reshape its workforce outreach efforts. In Baltimore, planners are using the tool to evaluate the city's road resurfacing program.
How It Works
The Urban Institute started developing its SEDT when conversations about Smart Cities and equity-driven decision-making were becoming more prevalent. Since its launch, SEDT has been used to examine everything from the locations of public Wi-Fi hotspots in New York City to broken McDonald's ice cream machines in Houston.
The tool's geographic disparity score compares the dispersal of data to how the user-selected target population is distributed. Meanwhile, the demographic disparity score assesses whether the demographics of the areas where data are located reflect the overall population.
A benefit of the tool is that it doesn't automatically assign value judgments, says Sonia Torres Rodriguez, a research associate at the Urban Institute. For example, if a user analyzes after-school program locations in a city, they might want those programs to be overrepresented in under-resourced areas.
"It moves us beyond just this disparity lens into thinking about targeting resources for the populations that need and deserve those resources," she says.
Atlanta's Workforce, Reconsidered
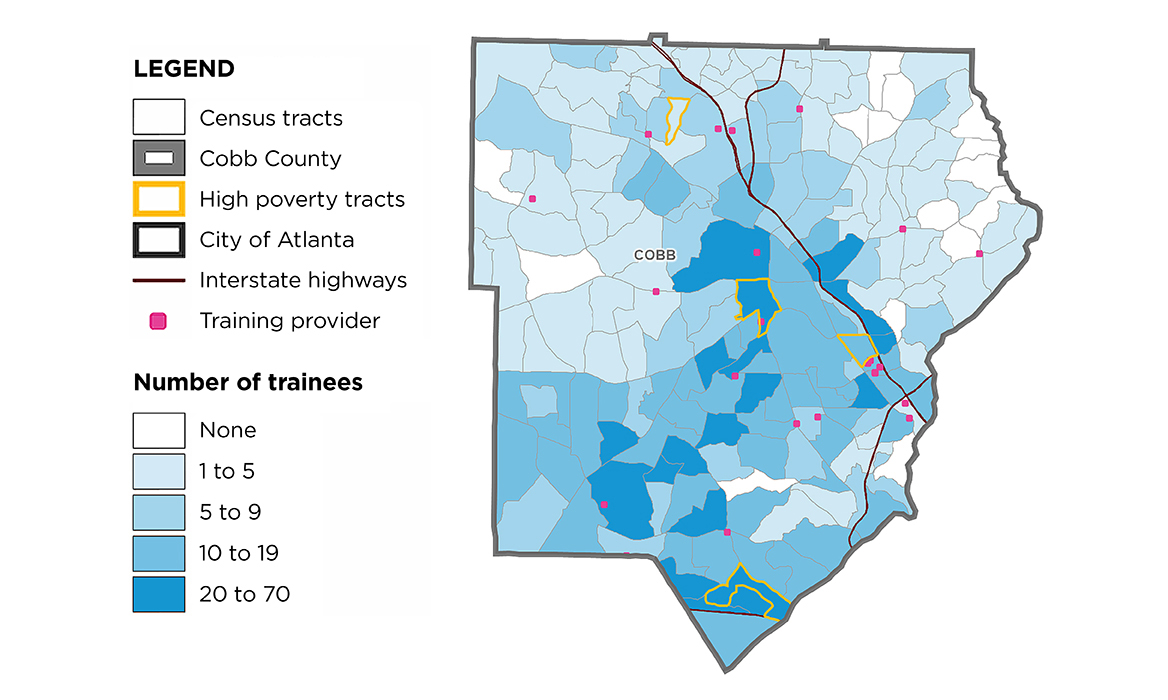
In Atlanta, Rich, a professor at Emory University, collaborated with the Urban Institute to create a case study as part of ongoing research into disparities in the workforce training programs of Work Source Metro Atlanta, which comprises five workforce development boards serving 10 counties. "SEDT provided a complementary approach to GIS analysis with various metrics on which demographic groups and areas were under- or overrepresented," says Rich, who also is a member of Work Source Metro Atlanta.
Using the SEDT API, they compared the locations of those eligible for training programs with the sites of workforce training providers in the area. The case study "confirmed the GIS findings," Rich says, and showed which areas could benefit from more outreach — as well as areas that were targeted effectively.
"This information was shared with the workforce boards, and Cobb, in particular, was very interested and aggressive in reorienting its outreach efforts in areas with relatively low take-up," Rich says. He adds that the team soon will be reviewing more recent data to identify potential trends over time and see whether shifts in approach have produced results.
Paving the Way in Baltimore
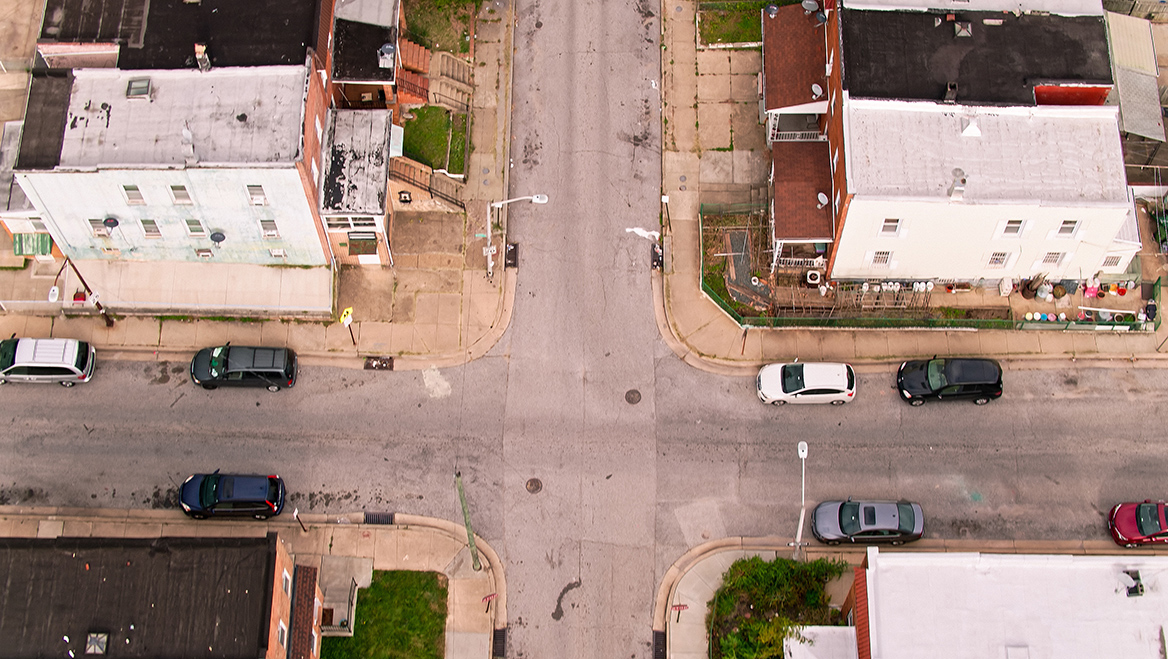
In Baltimore, planners collaborated with the Urban Institute to review road resurfacing projects with SEDT API and create a case study. Road resurfacing was chosen, in part, because it has an impact on the majority of residents. "Whether you're taking the bus or driving around, you are directly affected by the physical condition of the city streets," says Eli Pousson, senior data lead with the city's planning department.
Using data from 2019 to 2024 collected by the city's transportation department, they analyzed completed projects during that timeframe. "Our use of the tool is really an extension of an existing and ongoing effort to analyze and advocate for an equitable approach to the city's capital budget," he says.

The Baltimore City Department of Planning used the Spatial Equity Data Tool to make sure future capital investments in road resurfacing projects were reaching all neighborhoods equitably. Photo by halbergman/iStock/Getty Images Plus.
They didn't find a clear pattern of inequity in road resurfacing, and Pousson hopes to reuse the SEDT API to check out other capital investments like playgrounds, recreational facilities, or waterline improvements. "Our agency is dedicated to using inclusive and collaborative processes to expand access to power and resources for city residents, and this tool can help us in that work," he says.
Pousson also thinks the code that they created for the case study can be reused by other cities that are interested in using the tool.
Future of SEDT is 'Evolving'
The Urban Institute is working on a new access measure for the SEDT tool that has been piloted in Washington, D.C. and the surrounding area. It incorporates walk and drive times to model "how people in their day-to-day life could move across space to access resources," says Gabe Morrison, senior data scientist at the nonprofit.
Eventually, the Urban Institute plans to offer that functionality to users across the U.S., and Rich plans to use the feature to revisit data in Atlanta.
"We don't see SEDT as static," Stern says. "We want it to be growing — evolving."


