

Sept. 4, 2025
This story is part of Planning's "Tech Tools" series, created in collaboration with APA's Technology Division. From conservation planning and sharing information about extreme heat risk to tools that help visualize your urban design, this series highlights topical datasets, applications, and other tools that help planners understand — and better plan for — their communities.
Analyzing and communicating data is a key part of planners' jobs, but the information may not always be consistently reliable. Among the challenges are quality control, usability, the proliferation of AI-generated content, and — more recently — information going offline. A 2023 Pew Research Center study found about 38 percent of webpages that existed in 2013 were no longer available by 2023. At the federal level, recent developments have challenged the availability of information, as well. As organizations race to back up data and direct practitioners to planning-specific resources, it is necessary to support access to caches of previously available information, and bolster planners' capacities to maintain relevant, useful, and adaptable data sources and applications. Doing so is essential but requires investing in time and resources.
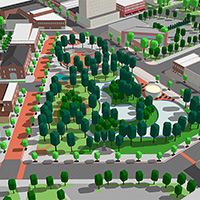
An example of this kind of local-scale data resilience and integration effort was used in the Tahoe Basin, but similar bespoke systems are now being built out at the state level — like the Vulnerable Communities Platform, a climate data modeling utility developed by the Integrated Climate Adaptation and Resiliency Program (ICARP) in California. Making an investment into developing systems like these is critical for the long-term resilience of our communities and will be beneficial across all levels of government.
Recommended digital tools
These tools, ranging from utilities for data collection and storage to visualization, can help planners collect, create, and accrue data, as well as convey vital information to the communities they represent.

Image courtesy of ODK.
ODK
Mobile Field Data Collection | Application | Data Platform
ODK is an open-source suite of tools that aid mobile data collection through customizable forms. Planners can build surveys using Excel-based templates (XLSForms), deploy them to mobile devices using ODK Collect, and sync submissions with a centralized server. ODK is widely used in humanitarian, public health, and environmental research fields, and supports offline data entry, skip logic, and multimedia attachments.
Cost: Free self-hosted server (paid hosting available)
Resource formats: Tabular, geospatial
Coding skills required: No (form building in Excel; server setup optional)

Image courtesy of Knime.
KNIME
Visual Workflow Builder | Data Analysis | Model Development
KNIME is a free open-source platform that allows users to create data processing and analysis workflows using a drag-and-drop interface. Planners can analyze datasets, process text, calculate indicators, and even apply machine learning models — all without writing code. KNIME supports integrations with databases, REST APIs, and Python scripts, making it useful for both general data processing and more specialized tasks, including scenario modeling or risk profiling.
Cost: Free (AI and collaboration features available with paid tiers)
Resource formats: Tabular, text, geospatial
Coding skills required: No (for basic use); yes (for advanced functions)

Image courtesy of Wix.
WIX
Website Builder | Visualization | Public Engagement Tool
Wix is a web-based site builder that enables planners to communicate findings, host dashboards, or share project updates with the public. Users can choose from templates or build custom pages using a drag-and-drop editor. While not built specifically for data visualization, Wix supports integration with charts, iframes, and web APIs. Consider checking your organization's policies on public hosting and data sharing before uploading sensitive information. The APA Tech Division also highlighted Google Sites as an alternative to Wix in a 2025 webinar.
Cost: Free, with ads (ad-free browsing and other features available with paid tiers)
Resource formats: Web/HTML
Coding skills required: No

Image courtesy of Jupyter.
JUPYTER NOTEBOOKS
Interactive Coding Environment | Analysis | Documentation
Jupyter Labs offers a web-based interface for combining code, narrative text, and outputs in one document. Widely used in research and data science, Jupyter Notebooks allows planners to document workflows, test data transformations, and share repeatable analytical processes. When paired with platforms like KNIME or open-source datasets, it can allow for live insights into data scenario testing and reporting. Users can run this utility through the desktop application or through their browser using JupyterLite. Similar utilities that do not require a download include Google CoLab and GitHub Codespaces.
Cost: Free
Resource formats: Markdown, HTML, Python
Coding skills required: Yes

Image courtesy of OSGeo.
MAPSERVER
GIS Rendering Engine | Open-Source Platform | Data Hosting Utility
MapServer is an open-source platform developed by the University of Minnesota for rendering spatial data and publishing interactive maps to the web. Maintained by the Open Source Geospatial Foundation, MapServer is lightweight and can be used on Windows, Linux, or Mac systems. While it does not function as a full GIS system, it supports planners who need to create web-based spatial data visualizations or host map services for project communication or analysis.
Cost: Free
Resource formats: Geospatial
Coding skills required: Yes
RECOMMENDED ARTICLES